Shield Health Metrics
Cluster Shield and Host Shield expose metrics related to their operational health. You can use Prometheus to collect these metrics and monitor the status of Cluster Shield and Host Shield in your environments, ensuring continuous protection and visibility.
Cluster Shield
Cluster Shield exposes health metrics at the /metrics endpoint on port 8080.
The Helm chart for Cluster Shield sets cluster.enable_prometheus_scraping to true by default.
The /metrics endpoint exposes metrics such as:
sysdig_cluster_shield_component_health_statuswhere- Value
1: healthy - Value
0: unhealthy
- Value
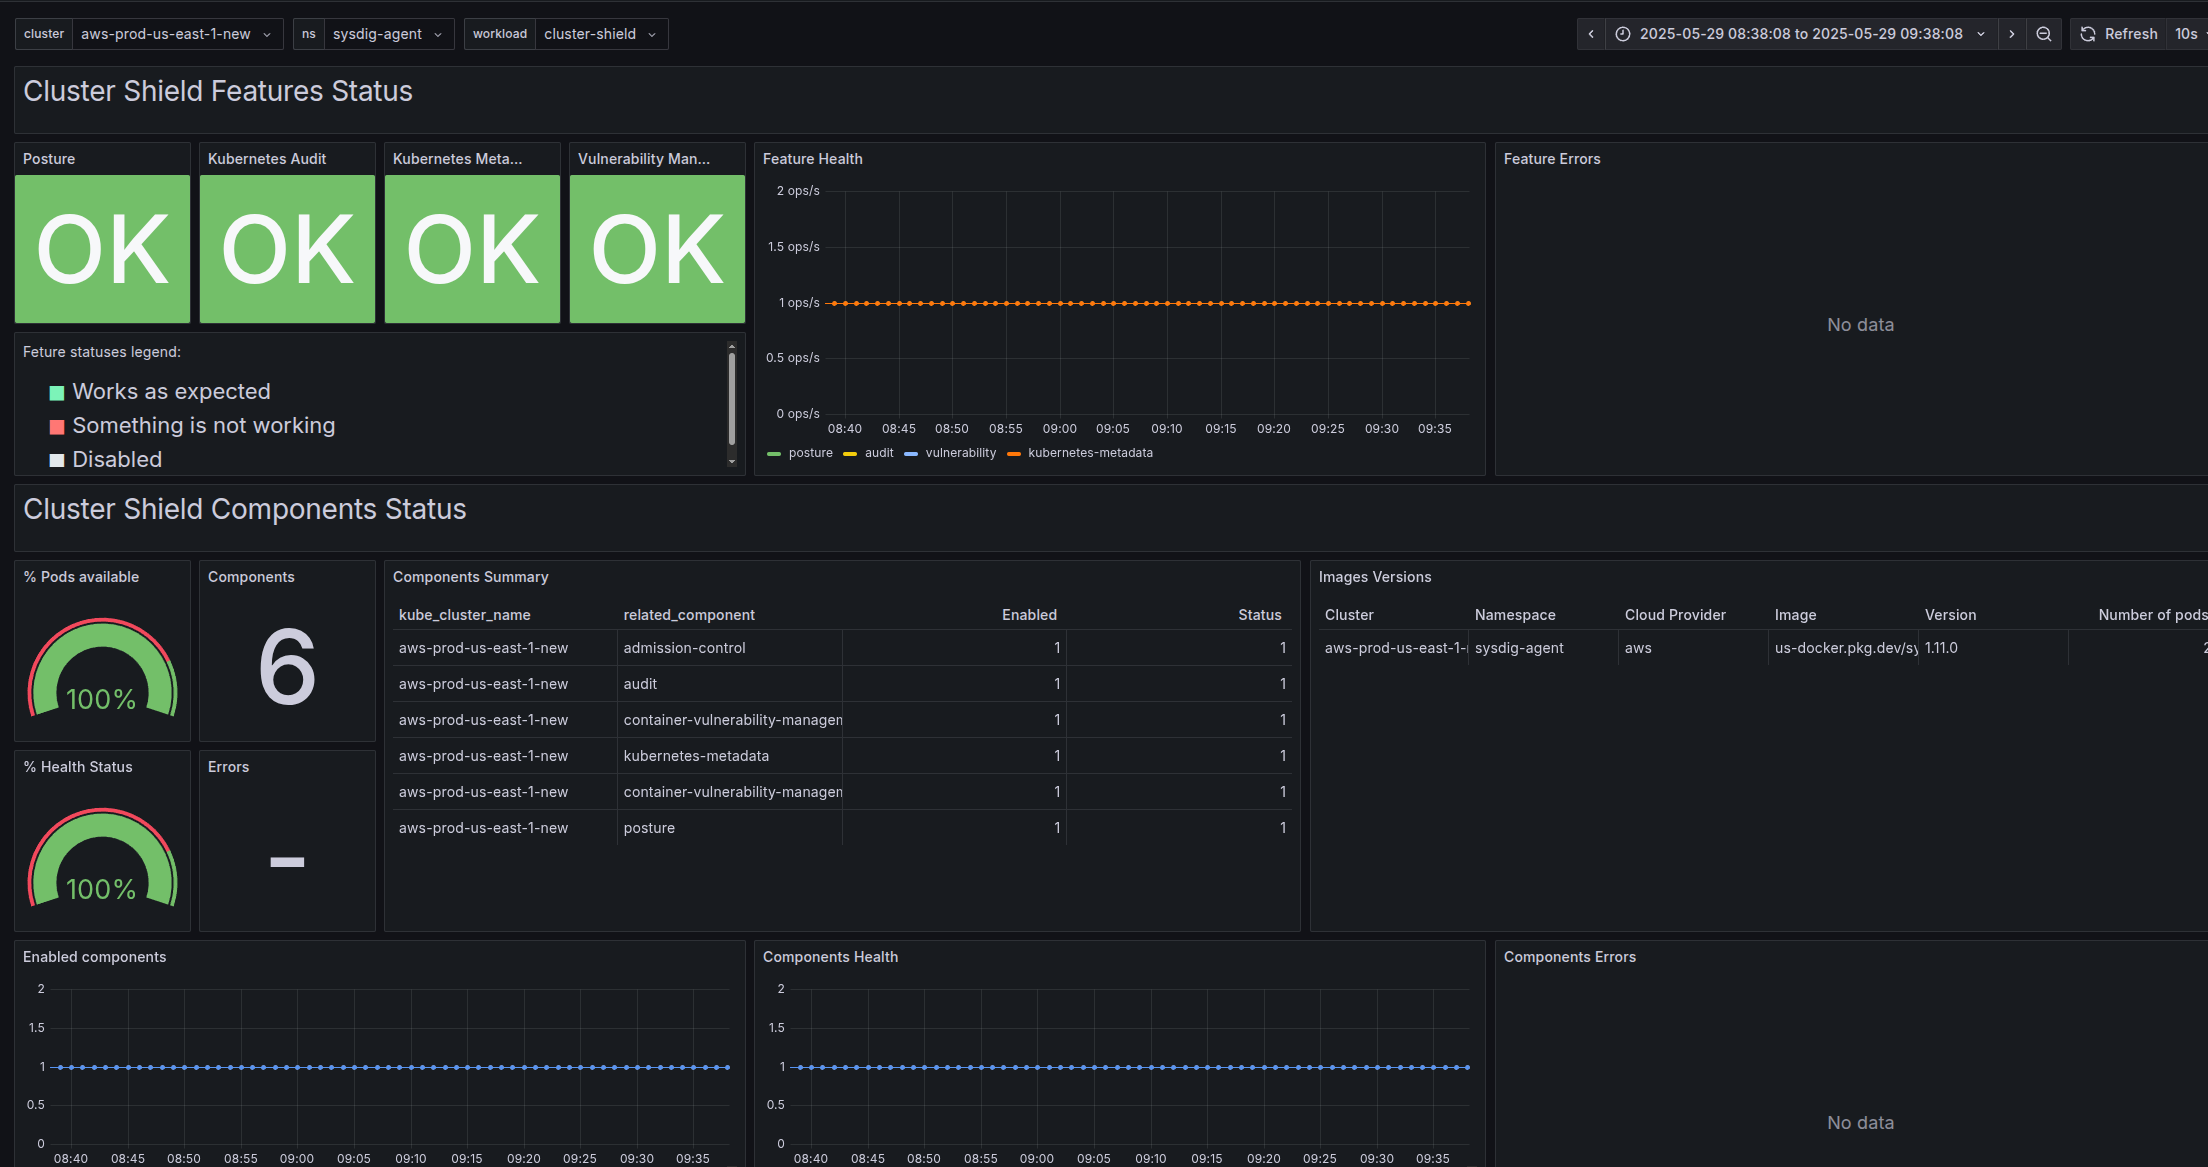
Viewing Metrics
Sysdig offers a simple method to monitor the Cluster Shield component, using Grafana dashboards. Go to Grafana dashboard to view the metrics.
Host Shield
Host Shield exposes health metrics with the /metrics endpoint on port 9544.
To enable Host Shield metrics in your Shield Chart, use the following configuration:
host:
  additional_settings:
    prometheus_exporter:
      enabled: true
      export_health_metrics: true

  pod_annotations:
    prometheus.io/scrape: 'true'
    prometheus.io/port: '9544'
    prometheus.io/path: '/metrics'
The /metrics endpoint exposes metrics such as:
sysdig_agent_connectedsysdig_agent_healthywhere- Value
1: healthy - Value
0: unhealthy
- Value
An extensive list of metrics is available at Agent Health metrics page.