Posture Overview
Access Overview
To access the Posture Overview page, go to Posture > Overview:
Log into Sysdig Secure (SaaS).
From the left navigation bar, select Posture > Overview.
The Overview page appears.
Key Highlights
The Posture Overview dashboard lets you identify and prioritize the highest-risk misconfigurations across your cloud environment. It highlights:
- Top high-severity misconfigurations across all resource types.
- Top misconfigurations overall.
- Least secure resources across your environment.
- Least secure resource categories in your architecture.
These insights help you streamline remediation and improve your cloud security posture.
Navigate Posture Overview
Review the top failing controls and riskiest resources, then drill down into findings and details to remediate.
- You can filter the dashboard globally using the following options in the upper-left corner:
- Zone: Logical groupings of resources such as accounts, clusters, or applications.
- Platform: Cloud platforms (for example, AWS, Azure, GCP).
Dashboard Panels
The Posture Overview dashboard is organized into several sections, each providing insights into different aspects of your cloud security posture.
North Star Metrics and Trends
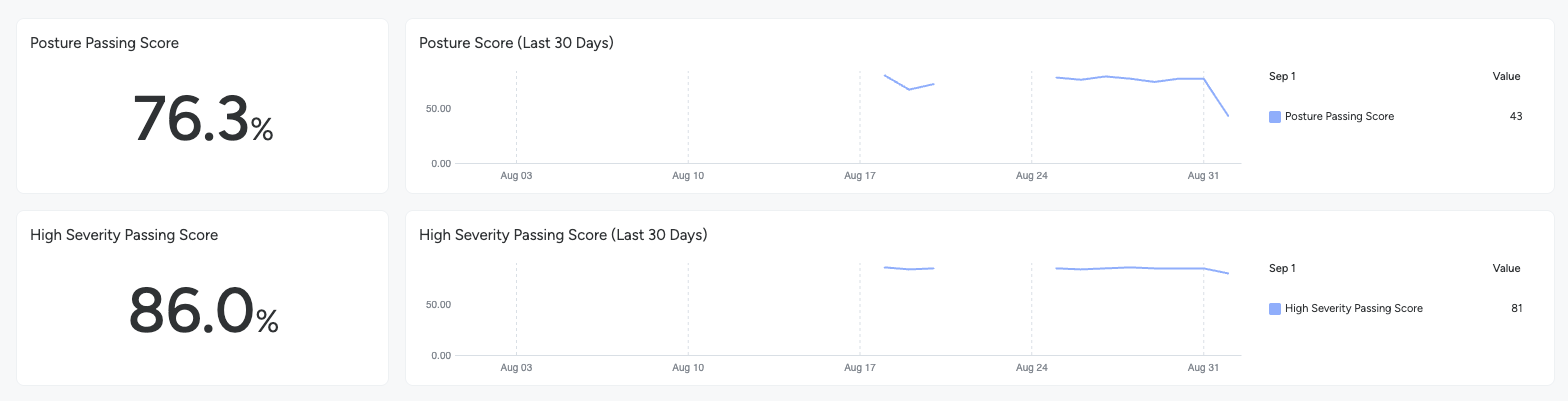
Posture Passing Score: Percentage of controls that pass across all severities. A higher score reflects stronger alignment with security best practices.
High Severity Passing Score: Percentage of controls that pass across high-severity findings. A higher score reflects effective remediation of the most critical misconfigurations.
Posture Score (Last 30 Days): A time-series view of Posture Passing Score, showing the percentage of passing controls over the last 30 days. You can detect posture improvements or regressions.
High Severity Passing Score (Last 30 Days): A time-series view of High Severity Passing Score, showing the percentage of passing high-severity controls over the last 30 days. You can monitor sustained progress on the most critical risks.
Posture Insights
As a Posture Program Owner, identifying resources failing multiple or high-severity controls is critical to prioritizing remediation efforts. The following widgets help highlight the riskiest resources and controls:
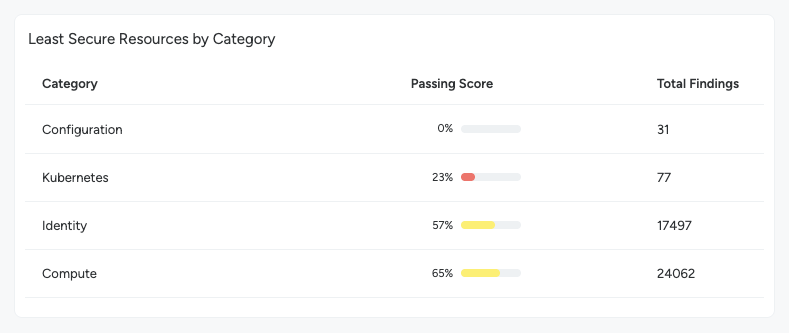
Least Secure Resources by Category: Lists resource categories with their passing scores and total findings, highlighting categories with the weakest posture.
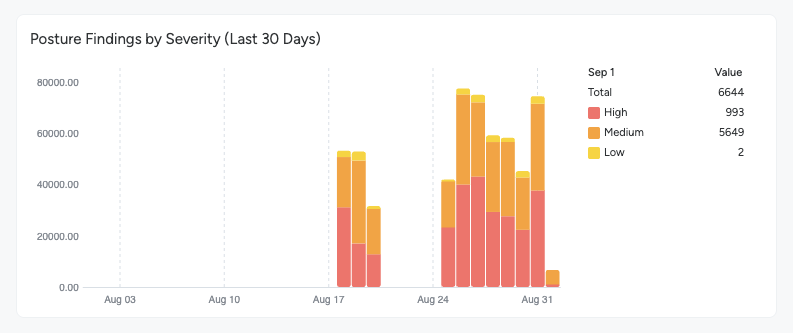
Posture Findings by Severity (Last 30 Days): Shows posture findings grouped by severity over the past month, enabling trend analysis of risk levels.
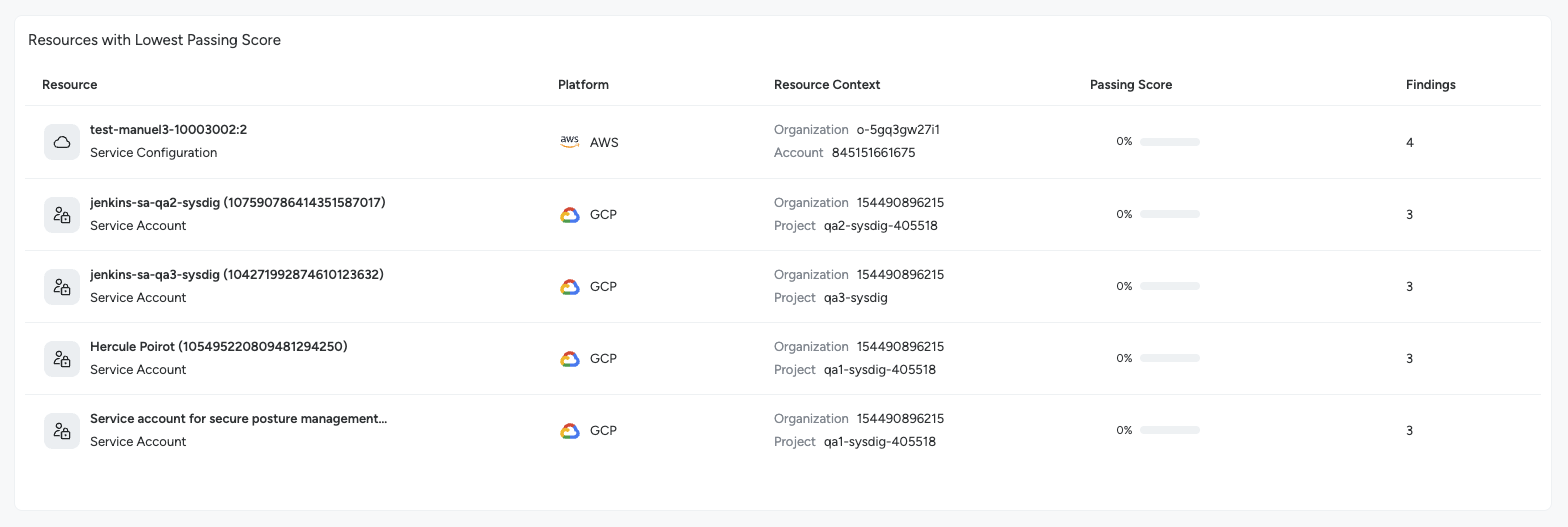
Resources with Lowest Passing Score: Displays resources with the lowest overall passing score across all controls, helping pinpoint the riskiest assets.
Controls with Lowest Passing Score (High Severity): Highlights high-severity controls most frequently failed, indicating which critical issues to remediate first.
Controls with Lowest Passing Score (All Severities): Provides a full view of all controls and their passing scores, complementing the high-severity focus for comprehensive posture assessment.
Least Secure Resources by Category
This widget shows how misconfigurations are distributed across resource types and services, helping Posture Program Owners identify patterns and systemic issues. Categories are sorted by passing score in ascending order.
Fields:
- Category: Resource category (for example, AI, Application, Compute).
- Passing Score: Average passing score of resources in the category.
- Total Findings: Total number of posture findings in the category.
Posture Findings by Severity (Last 30 Days)
Tracks the number and severity of failed controls over time, enabling risk trend analysis.
Fields:
- Severity (color-coded): Severity of the control failure (High, Medium, Low).
- Findings (vertical axis): Number of posture findings on a given date.
- Date (horizontal axis): Date of evaluation.
Resources with Lowest Passing Score
Shows the riskiest assets based on overall passing score. You can sort by any column.
Fields:
- Resource: Resource name and type (for example, Cloud SQL Backup Run, S3 Bucket, IAM Policy).
- Passing Score: Percentage of controls passing for the resource.
- Findings: Number of controls failing the resource.
Controls with Lowest Passing Score (High Severity)
Shows high-severity controls that most often fail across your environment. You can sort by any column.
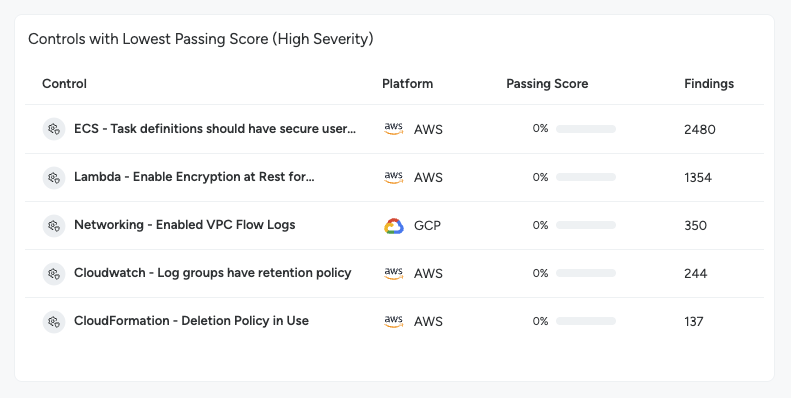
Fields:
- Control: Control name and target resource type.
- Passing Score: Percentage of resources passing the control.
- Findings: Number of resources failing the control.
- Platform: Target platform (for example, Kubernetes, AWS, Azure).
Controls with Lowest Passing Score (All Severities)
Shows all controls sorted by performance, providing a comprehensive view of posture. You can sort by any column.
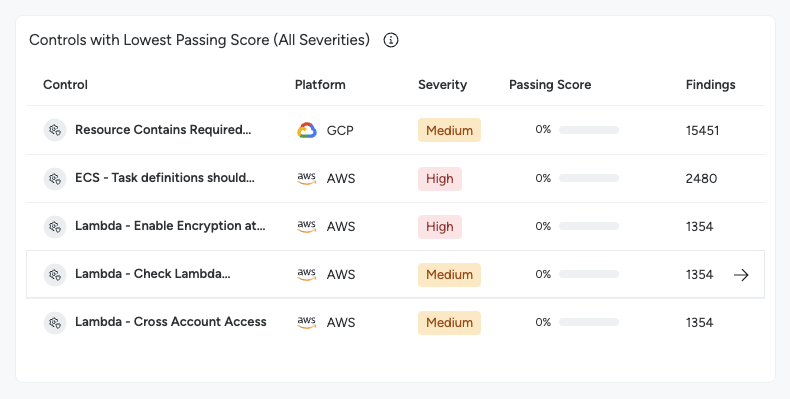
Fields:
- Control: Control name and target resource type.
- Severity: Control severity (High, Medium, Low).
- Passing Score: Percentage of resources passing the control.
- Findings: Number of resources failing the control.
Zone-Based Posture Insights
As a Posture Program Owner, understanding how risks are distributed across zones (for example, dev, staging, production) is critical to prioritizing remediation efforts. The following widgets help highlight the zones with the weakest posture and track improvements over time:
Least Secure Zones: Lists zones with the lowest high-severity passing scores, helping focus on the riskiest areas first.
Zone Passing Score (Last 30 Days): Shows zone passing scores over time, enabling trend analysis of improvements or regressions across zones.
Least Secure Zones
Lists zones sorted by high-severity passing score in ascending order, allowing you to focus on the worst-performing zones. You can sort by any column.
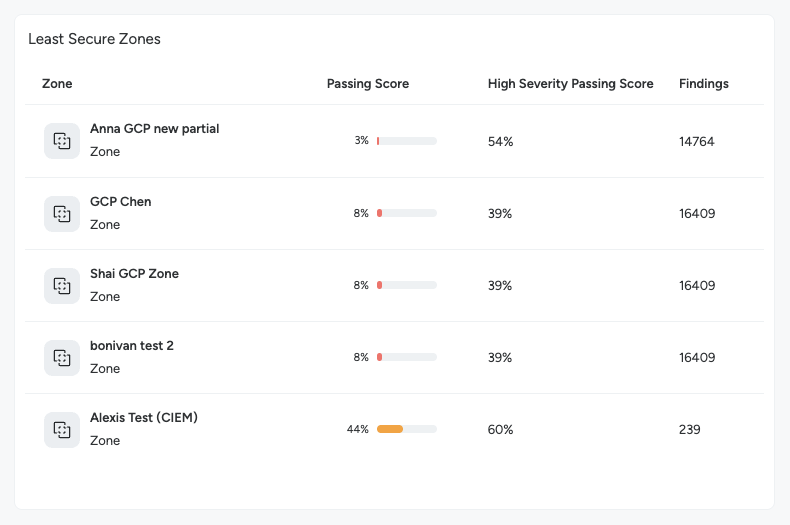
Fields:
- Zone: Zone name.
- Passing Score: Percentage of all controls passing across resources in the zone.
- High Severity Passing Score: Percentage of high-severity controls passing across resources in the zone.
- Findings: Number of control failures across resources in the zone.
Zone Passing Score (Last 30 Days)
Shows passing score trends per Zone over the past 30 days.
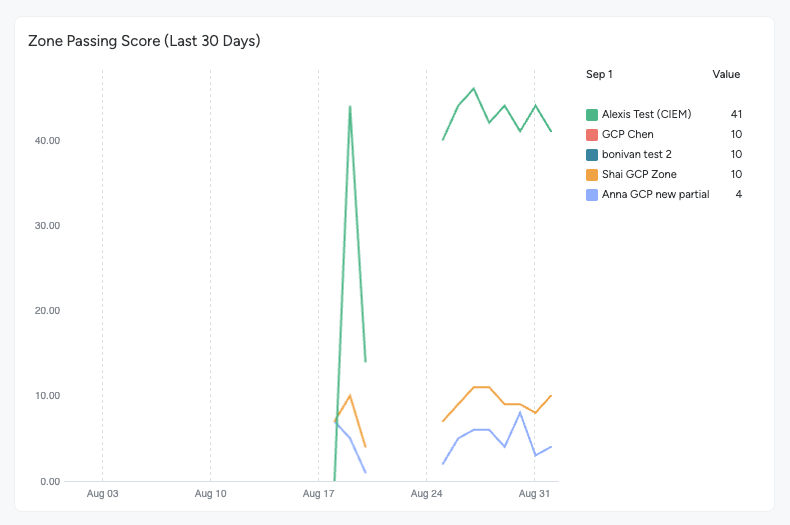
Fields:
- Zone (color coded): Zone name.
- Passing Score (vertical axis): Percentage of controls passing on a given date.
- Date (horizontal axis): Date of evaluation.
