Kubernetes Audit Integration
This integration allows you to observe and monitor:
- Creation and destruction of pods, services, deployments, daemon sets
- Creating/updating/removing config maps or secrets
- Attempts to subscribe to changes to any endpoint
and other operations performed on Kubernetes resources.
Setup methods
There are two alternative ways to set up this integration:
- Emulated audit logs (default): uses a Dynamic Admission Control to get notified whenever a resource change is submitted:
- It’s standard across all Kubernetes distributions, and easy to set up
- It doesn’t provide logs for Get/List/Watch operations
- It doesn’t provide IPs/User Agents
- Audit backend: relies on logs generated by the API server for any operation, as per the Audit Policy.
- It has the most complete visibility on all APIs, along with IPs and User Agents
- It officially needs to be set up to access the control plane, so set it up on managed when that access is not available, like in Managed distributions, is different on each use case, and logs can also have different formats.
- It is only available on Linux
Prerequisites
- Helm v3.8 or above
- Install Sysdig Shield on Kubernetes using Helm
Emulated audit logs method setup
Recommended: Replace
helm installwithhelm upgrade --install.To enable Kubernetes audit logging in your existing Sysdig Secure Helm install command, add the following flag:
--set features.detections.kubernetes_audit.enabled=trueFor On-Prem < 7.4, set the Sysdig Secure API token. The API Token needs to belong to a user with a Role containing the permission Policies | Runtime Policies =
READ.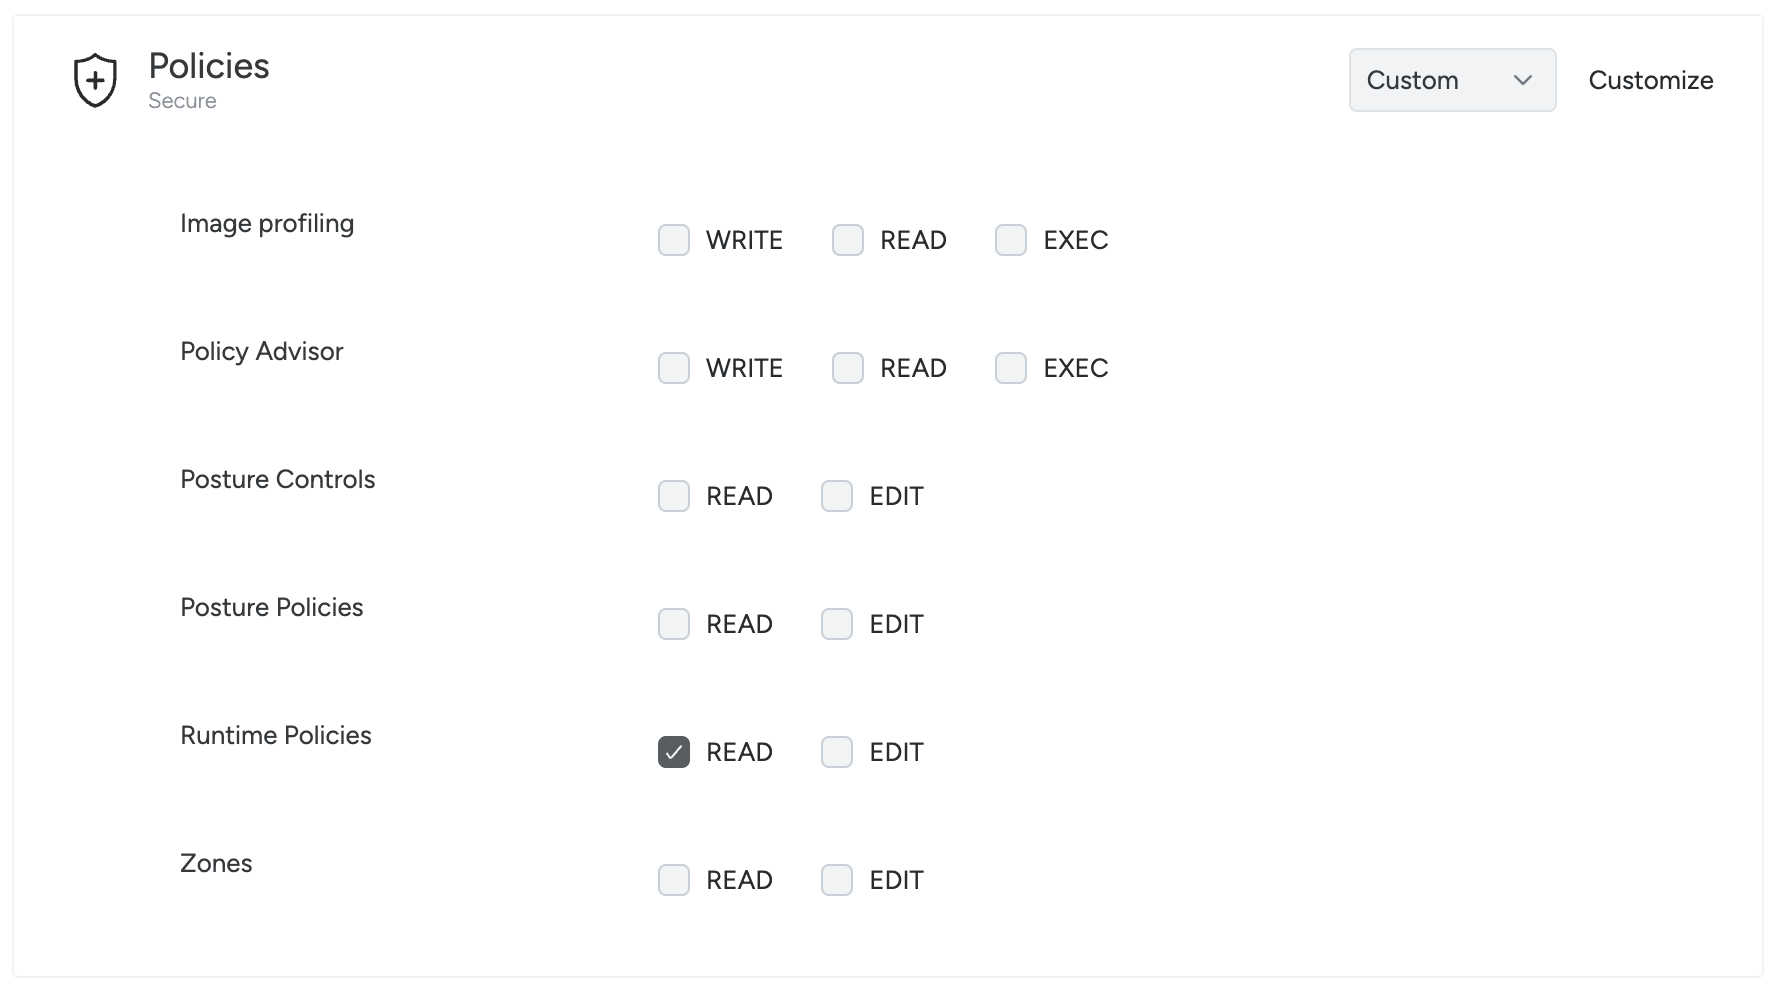
Set that in Helm as well:
--set sysdig_endpoint.secure_api_token="<YOUR_SYSDIG_API_TOKEN_HERE>"
For additional configuration options, refer to the installation guide and the configuration reference.
Audit backend method setup
This setup exposes a webhook through a Kubernetes Service, using the Shield chart. It then needs to be manually connected to the Kubernetes cluster audit log.
This setup heavily depends on Kubernetes distributions and their versions. We guide you through setting up the Service and only provide examples to connect this in some distributions.
For further support, please contact your Sysdig representative or Sysdig support.
Audit Log Webhook deployment
Recommended: Replace
helm installwithhelm upgrade --install.To enable the Audit Log Webhook in your existing Sysdig Secure Helm install command, add the following flags:
 --set host.additional_settings.security.k8s_audit_server_enabled=true
 --set host.additional_settings.security.k8s_audit_server_url=0.0.0.0
 --set host.additional_settings.security.k8s_audit_server_port=7765
Create a Service to expose it:
 apiVersion: v1
 kind: Service
 metadata:
   name: sysdig-shield-audit
   namespace: sysdig
 spec:
   type: ClusterIP
   ports:
     - port: 7765
       protocol: TCP
       name: audit
   selector:
     app.kubernetes.io/instance: shield
     app.kubernetes.io/name: shield
     sysdig/component: host
This will create a Webhook listening on 0.0.0.0:7765, which can be reached via http://sysdig-shield-audit.sysdig.svc.cluster.local:7765/k8s_audit. Kubernetes Audit Logs are defined in the audit.k8s.io/v1 API Group. Read more in the official Kubernetes documentation.
Sending Audit Logs to the Webhook
This section provides examples of how to configure this in different Kubernetes distributions.
OpenShift
Starting from Logging 5.7, it’s possible to set up a ClusterLogForwarder to send Audit Logs to an HTTP backend.
It relies on a Service Account to operate, so:
- Start the creation with
kubectl create serviceaccount logging-sa -n sysdig - Bind it to the ClusterRole required
kubectl create clusterrolebinding logging-sa-binding \ --clusterrole=cluster-admin --serviceaccount=sysdig:logging-sa
Then, install the operator:
- Open the OpenShift Web Console.
- Navigate to Ecosystem -> Software Catalog
- Select
sysdigin the project list. - Search for “openshift logging” in the search bar.
- Install the Red Hat OpenShift Logging operator.
- Choose
sysdigas the Installed namespace. - Create a ClusterLogForwarder using the configuration below.
apiVersion: observability.openshift.io/v1
kind: ClusterLogForwarder
metadata:
 name: logging
 namespace: sysdig
spec:
 outputs:
   - name: cluster-shield-audit-webhook
     http:
       method: POST
       url: 'http://sysdig-shield-audit.sysdig.svc.cluster.local:7765/k8s_audit'
     type: http
 pipelines:
   - inputRefs:
       - audit
     name: audit-log-pipeline
     outputRefs:
       - cluster-shield-audit-webhook
 serviceAccount:
   name: logging-sa
Kops
To implement this in kops you need to edit the cluster configuration.
Start by obtaining the current cluster configuration and saving it to a file:
kops get cluster <your cluster name> -o yaml > cluster-current.yamlEdit
cluster-current.yaml, merging it with the YAML below, replacing what already exists and adding what’s missing. You can find the content of thewebhook-configandaudit-policyfile assets in the dedicated sections:- Audit Policy, to replace
AUDIT_POLICY_FILE_CONTENT - Webhook configuration, to replace
WEBHOOK_CONFIG_FILE_CONTENT.
spec: fileAssets: - name: webhook-config path: /var/lib/k8s_audit/webhook-config.yaml roles: [Master] content: | WEBHOOK_CONFIG_FILE_CONTENT - name: audit-policy path: /var/lib/k8s_audit/audit-policy.yaml roles: [Master] content: | AUDIT_POLICY_FILE_CONTENT kubeAPIServer: auditLogPath: /var/lib/k8s_audit/audit.log auditLogMaxBackups: 1 auditLogMaxAge: 10 auditLogMaxSize: 100 auditWebhookBatchMaxWait: 5s auditPolicyFile: /var/lib/k8s_audit/audit-policy.yaml auditWebhookConfigFile: /var/lib/k8s_audit/webhook-config.yaml- Audit Policy, to replace
Configure Kops with the new cluster configuration:
kops replace -f cluster.yamlUpdate the cluster configuration to prepare changes to the cluster:
kops update cluster <your cluster name> --yesPerform a rolling update to redeploy the master nodes with the new files and API server configuration:
kops rolling-update cluster --yes
GKE
GKE provides Kubernetes audit logs, but the logs are stored in Cloud Logging and are in a different format than the native format used by Kubernetes. You can read more in the official documentation.
As a preliminary step, enable the Audit log generation in your cluster.
- Using the CLI:
gcloud container clusters update YOUR_CLUSTER_NAME --logging=SYSTEM,WORKLOAD,API_SERVER. See the Google Cloud documentation for additional details - Using the Console: GKE Cluster -> Details tab -> Features section -> Logging option. Edit it and select “Enable Logging”. Select at least “Workloads” and “API Server” among the available components.
Additional information is available in the official documentation.
Once this step is completed, logs are available to be queried in Logs Explorer:
protoPayload.@type="type.googleapis.com/google.cloud.audit.AuditLog"
resource.labels.cluster_name="YOUR_CLUSTER_NAME"
Those logs need to be now routed to the Service and converted from the Google to the Kubernetes Audit format. As an example, you can have a worker reading from Google Cloud Logging, transforming the logs and sending those events to the Service. You can find that in a public repository.
To deploy it:
Create a Google Cloud (not Kubernetes) service account and key that has the ability to read logs:
gcloud iam service-accounts create swb-logs-reader --description "Service account used by stackdriver-webhook-bridge" --display-name "stackdriver-webhook-bridge logs reader"
gcloud projects add-iam-policy-binding <your gce project id> --member serviceAccount:swb-logs-reader@<your gce project id>.iam.gserviceaccount.com --role 'roles/logging.viewer'
gcloud iam service-accounts keys create $PWD/swb-logs-reader-key.json --iam-account swb-logs-reader@<your gce project id>.iam.gserviceaccount.com
Create a Kubernetes secret containing the service account keys:
kubectl create secret generic stackdriver-webhook-bridge --from-file=key.json=$PWD/swb-logs-reader-key.json -n sysdigDeploy the bridge program to your cluster using the provided stackdriver-webhook-bridge.yaml file:
kubectl apply -f stackdriver-webhook-bridge.yaml -n sysdig
GKE uses a Kubernetes audit policy that emits a more limited set of information than the one recommended by Sysdig. As a result, there are several limitations when retrieving Kubernetes audit information for the Events feed and Activity Audit features in Sysdig Secure.
Request Object
In particular, audit events for config maps in GKE generally do not contain a requestObject field that contains the object being created/modified.
Pod exec does not Include command/container
For many Kubernetes distributions, an audit event representing a
pod exec includes the command and specific container as arguments to
the requestURI. For example:
"requestURI": "/api/v1/namespaces/default/pods/nginx-deployment-7998647bdf-phvq7/exec?command=bash&container=nginx1&container=nginx1&stdin=true&stdout=true&tty=true
In GKE, the audit event is missing those request parameters.
Implications for the Event Feed
If the rule condition includes a field that is not available in the Kubernetes audit log provided by GKE, the rule will not trigger.
For example, rules targeting changes to ConfigMap content containing specific information or specific commands being executed will not trigger, leading to missed detections/false negatives.
This will also limit the information that can be displayed in the outputs of
rules. For example the command=%ka.uri.param[command] output variable
in the Attach/Exec Pod rule will always return N/A.
Implications for Activity Audit
kubectl execelements will not be scoped to the cluster name; they will only be visible scoping byentire infrastructure"A
kubectl execitem in Activity Audit will not display command or container informationDrilling down into a
kubectl execwill not provide the container activity as there is no information that allows Sysdig to correlate thekubectl execaction with an individual container.
EKS
Amazon EKS does not provide webhooks for audit logs, but it allows audit logs to be forwarded to CloudWatch.
To enable your EKS cluster generating Audit logs in CloudWatch:
- Open your cluster in EKS
- Select the Observability tab
- In the Control plane logs section, Click “Manage”
- Ensure “Audit” is selected and click “Save changes”
Afterward, you’ll need to send those logs from CloudWatch to your listening webhook. You can achieve this in different ways. For example:
- Have a workload in your cluster periodically read from CloudWatch and relay the logs to the webhook. Here you can find an example for that setup.
- Set up a subscription to a Lambda, sending those logs to the webhook.
Please remember that logs must be in the Kubernetes Audit format in order to be processed, so a Firehose subscription isn’t a suitable option as of now, unless you intend to unwrap that payload before sending it to the webhook.
For logs from the Sysdig agent, proceed as follows:
- Enable CloudWatch logs for your EKS cluster.
- Allow access to CloudWatch from the worker nodes.
- Add a new deployment that polls CloudWatch and forwards events to the Sysdig agent.
You can find anexample configuration that can be implemented with the AWS UI, along with the code and the image for an example audit log forwarder. (In a production system this would be implemented as IaC scripts.)
Please note that CloudWatch is an additional AWS paid offering. In addition, with this solution, all the pods running on the worker nodes will be allowed to read CloudWatch logs through AWS APIs.
AKS
In AKS, you can enable Audit Logs generation using Diagnostic Settings for the cluster. You can refer to the official documentation to set this up.
Those Diagnostic Settings will be used to route those logs to a destination which, unfortunately, can’t be the Sysdig webhook, directly. There are a few alternative architectures, but our suggestion is to employ Event Hub as a target.
If you choose this route, you will need something to subscribe to the Event Hub stream and send those events to the webhook. This can be achieved in many ways, among those:
- Use a Kubernetes deployment, like in the example available in this repository
- Use Logic App, triggering on events available on Event Hub and sending requests to the service, correctly exposed.
RKE/K3s
Audit support is already enabled by default, but the audit policy must be updated to provide additional granularity. These instructions enable a webhook backend pointing to the agent’s service.
The following steps need to be applied on each node in the control plane:
Follow the official documentation to edit the Audit policy. This is the link to v2.13; verify the exact procedure for your version. You can find a suggested Policy here.
Next, create the Webhook Configuration. Based on the distribution/version:
/var/lib/rancher/{rke2,k3s}/server/audit-webhook.yaml. You can find the content here, where you can use the pod network option.This configuration then needs to be used by the Cluster. This is applied via the control plane configuration (
/etc/rancher/rke2/config.yaml) or as arguments (SystemD approach)audit-policy-file=/var/lib/rancher/rke2/server/audit.yamlaudit-webhook-config-file=/var/lib/rancher/rke2/server/audit-webhook.yamlaudit-webhook-batch-max-size=100audit-webhook-batch-max-wait=5s
Finally, restart the nodes
IKS
IKS supports generating Audit Logs and forwarding them to an HTTP endpoint. The sole caveat is that the API server runs outside the cluster network and, therefore, needs to reach the webhook through its IP. The other limitation is on the generated logs, where the configured policy cannot be changed.
You can refer to IBM documentation to set this up. The Webhook URL can be obtained by looking at the Service previously set up"
echo "http://$(kubectl get service sysdig-shield-audit -n sysdig -o jsonpath='{.spec.clusterIP}'):7765/k8s_audit"
Minikube
Minikube lets you manage the Control plane directly, so you can specify the Audit Policy and the Audit backend directly.
This is accomplished using the --extra-config parameter of the minikube start command, changing the apiserver configurations, as shown in the tutorial of Minikube.
See the reference for the minikube start command in the Minikube documentation and the apiserver configurations in the official Kubernetes documentation.
In each node of the Control plane, as suggested by the tutorial, create the audit-policy.yaml as well as the webhook-config.yaml files in the ~/.minikube/files/etc/ssl/certs directory. Afterward, you can restart Minikube by specifying the following options:
--extra-config=apiserver.audit-policy-file=/etc/ssl/certs/audit-policy.yaml--extra-config=apiserver.audit-log-path=---extra-config=apiserver.audit-webhook-config-file=/etc/ssl/certs/webhook-config.yaml--extra-config=apiserver.audit-webhook-batch-max-size=10--extra-config=apiserver.audit-webhook-batch-max-wait=5s
Kubeadm
With Kubeadm you manage the Control Plane directly so you can create the audit-policy.yaml and the webhook-config.yaml files in the /etc/kubernetes/ folder.
Then, make the Control plane use them. Create /etc/kubernetes/kubeadm-audit-config.yaml with:
apiVersion: kubeadm.k8s.io/v1beta4
kind: ClusterConfiguration
kubernetesVersion: v1.16.0
apiServer:
  extraArgs:
  - name: "audit-policy-file"
    value: "/etc/kubernetes/audit-policy.yaml"
  - name: "audit-log-path"
    value: "-"
  - name: "audit-webhook-config-file"
    value: "/etc/kubernetes/webhook-config.yaml"
  - name: "audit-webhook-batch-max-size"
    value: "10"
  - name: "audit-webhook-batch-max-wait"
    value: "5s"
Finally, run kubeadm init --config /etc/kubernetes/kubeadm-audit-config.yaml
See the official documentation for additional information.
Reference: Audit Policy
This is a general-purpose Audit Policy you can use to audit all the relevant events in the Control Plane. Adjust it based on your use case, if needed.
apiVersion: audit.k8s.io/v1
kind: Policy
omitStages:
- "RequestReceived"

rules:
# Ignore low-impact read-only URLs
- level: None
  userGroups: ["system:authenticated"]
  nonResourceURLs:
  - "/api*"
  - "/version"
  - "/healthz"
  - "/readyz"
  - "/livez"

# Ignore system noise
- level: None
  users:
  - "system:kube-proxy"
  - "system:kube-scheduler"
  - "system:kube-controller-manager"
  verbs: ["get", "list", "watch"]

# Log exec, attach, port-forward at RequestResponse (capture commands)
- level: RequestResponse
  verbs: ["create"]
  resources:
  - group: ""
    resources: ["pods/exec", "pods/attach", "pods/portforward"]

# Log security-sensitive resources at RequestResponse level
- level: RequestResponse
  resources:
  - group: ""
    resources: ["secrets", "serviceaccounts"]
  - group: "rbac.authorization.k8s.io"
    resources: ["roles", "rolebindings", "clusterroles", "clusterrolebindings"]
  - group: "networking.k8s.io"
    resources: ["networkpolicies"]
  - group: "policy"
    resources: ["podsecuritypolicies"]

# Log pod and deployment changes at RequestResponse
- level: RequestResponse
  resources:
  - group: ""
    resources: ["pods", "services", "persistentvolumes", "persistentvolumeclaims"]
  - group: "apps"
    resources: ["deployments", "daemonsets", "statefulsets", "replicasets"]

# Log configmap changes
- level: Request
  resources:
  - group: ""
    resources: ["configmaps"]

# Catch-all at Metadata level
- level: Metadata
  omitStages:
  - "RequestReceived"
Reference: Webhook configuration
This is a standard configuration for the audit webhook. Based on the networking your Control Plane uses, you should set AUDIT_WEBHOOK_ENDPOINT differently:
sysdig-shield-audit.sysdig.svc.cluster.localif it uses the pod networking and can access the Cluster DNS- The ClusterIP corresponding to the Service, if it runs outside the pod networking. This can be obtained via:
kubectl get service sysdig-shield-audit -n sysdig -o jsonpath='{.spec.clusterIP}')
apiVersion: v1
kind: Config
clusters:
- name: sysdig
  cluster:
    server: http://AUDIT_WEBHOOK_ENDPOINT:7765/k8s_audit
  users:
  - name: sysdig
  contexts:
  - context:
      cluster: sysdig
      user: sysdig
    name: sysdig
  current-context: sysdig
Next Steps
Once this is set up, you will see:
- Events in the Events Feed, if you enabled Kubernetes Audit Threat detection policies and any Audit log matches the rules they contain.
- Activity Audit entries for the Kubernetes Data source (
attach/exec).