Home
For the Home page dashboards to display data, ensure that you complete basic onboarding and connect at least one data source; otherwise, the page provides prompts to complete the setup tasks.
Secure Home
Sysdig is introducing a new Secure Home: a curated, out-of-the-box landing experience that brings your most important security signals together into a single overview, with no setup or dashboard building required. This first version is a curated, value-oriented experience, so the most relevant insights are presented consistently and immediately.
When the new Secure Home is available to you, you can switch between the new Home and the existing experience at any time. The rest of this page describes the existing experience.
The new Secure Home is being rolled out progressively, so it may not yet be available in your environment.
Sections
The new Secure Home organizes content into collapsible sections, each grouping a curated set of related panels by security domain:
- Runtime: Surfaces runtime detection signals, such as event trends and the policies and rules generating the most activity.
- Vulnerabilities: Highlights your most critical and exploitable findings across resources, images, and repositories.
- Posture: Summarizes compliance and posture health, including passing scores and the resources and controls that need the most attention.
- Identity: Surfaces identity risk, including high-severity findings, unused permissions, and inactive identities.
Section titles help the page stay meaningful across different product editions. The sections available to you depend on your product edition and the capabilities you have set up.
Check the Data Source Status
You can view and check a status summary of data sources at the top right of the page. These include:
- Detected cloud accounts
- Sysdig agents status, based on nodes where agents have been or could be deployed.
View Cloud Accounts
Select the AWS, GCP,or Azure icon to connect a cloud account, or to see the status of connected accounts.
For connected accounts, you can see:
- The number of accounts, projects, or subscriptions connected
- The connection status of the cluster
- A link to the Data Sources page, where you can take action
View Sysdig Agents
Select the Sysdig Agents icon to see:
- The number of agents connected
- The nodes that require attention because their agents are out of date or almost out of date
- The agent status
- A link to the Data Sources page, where you can take action
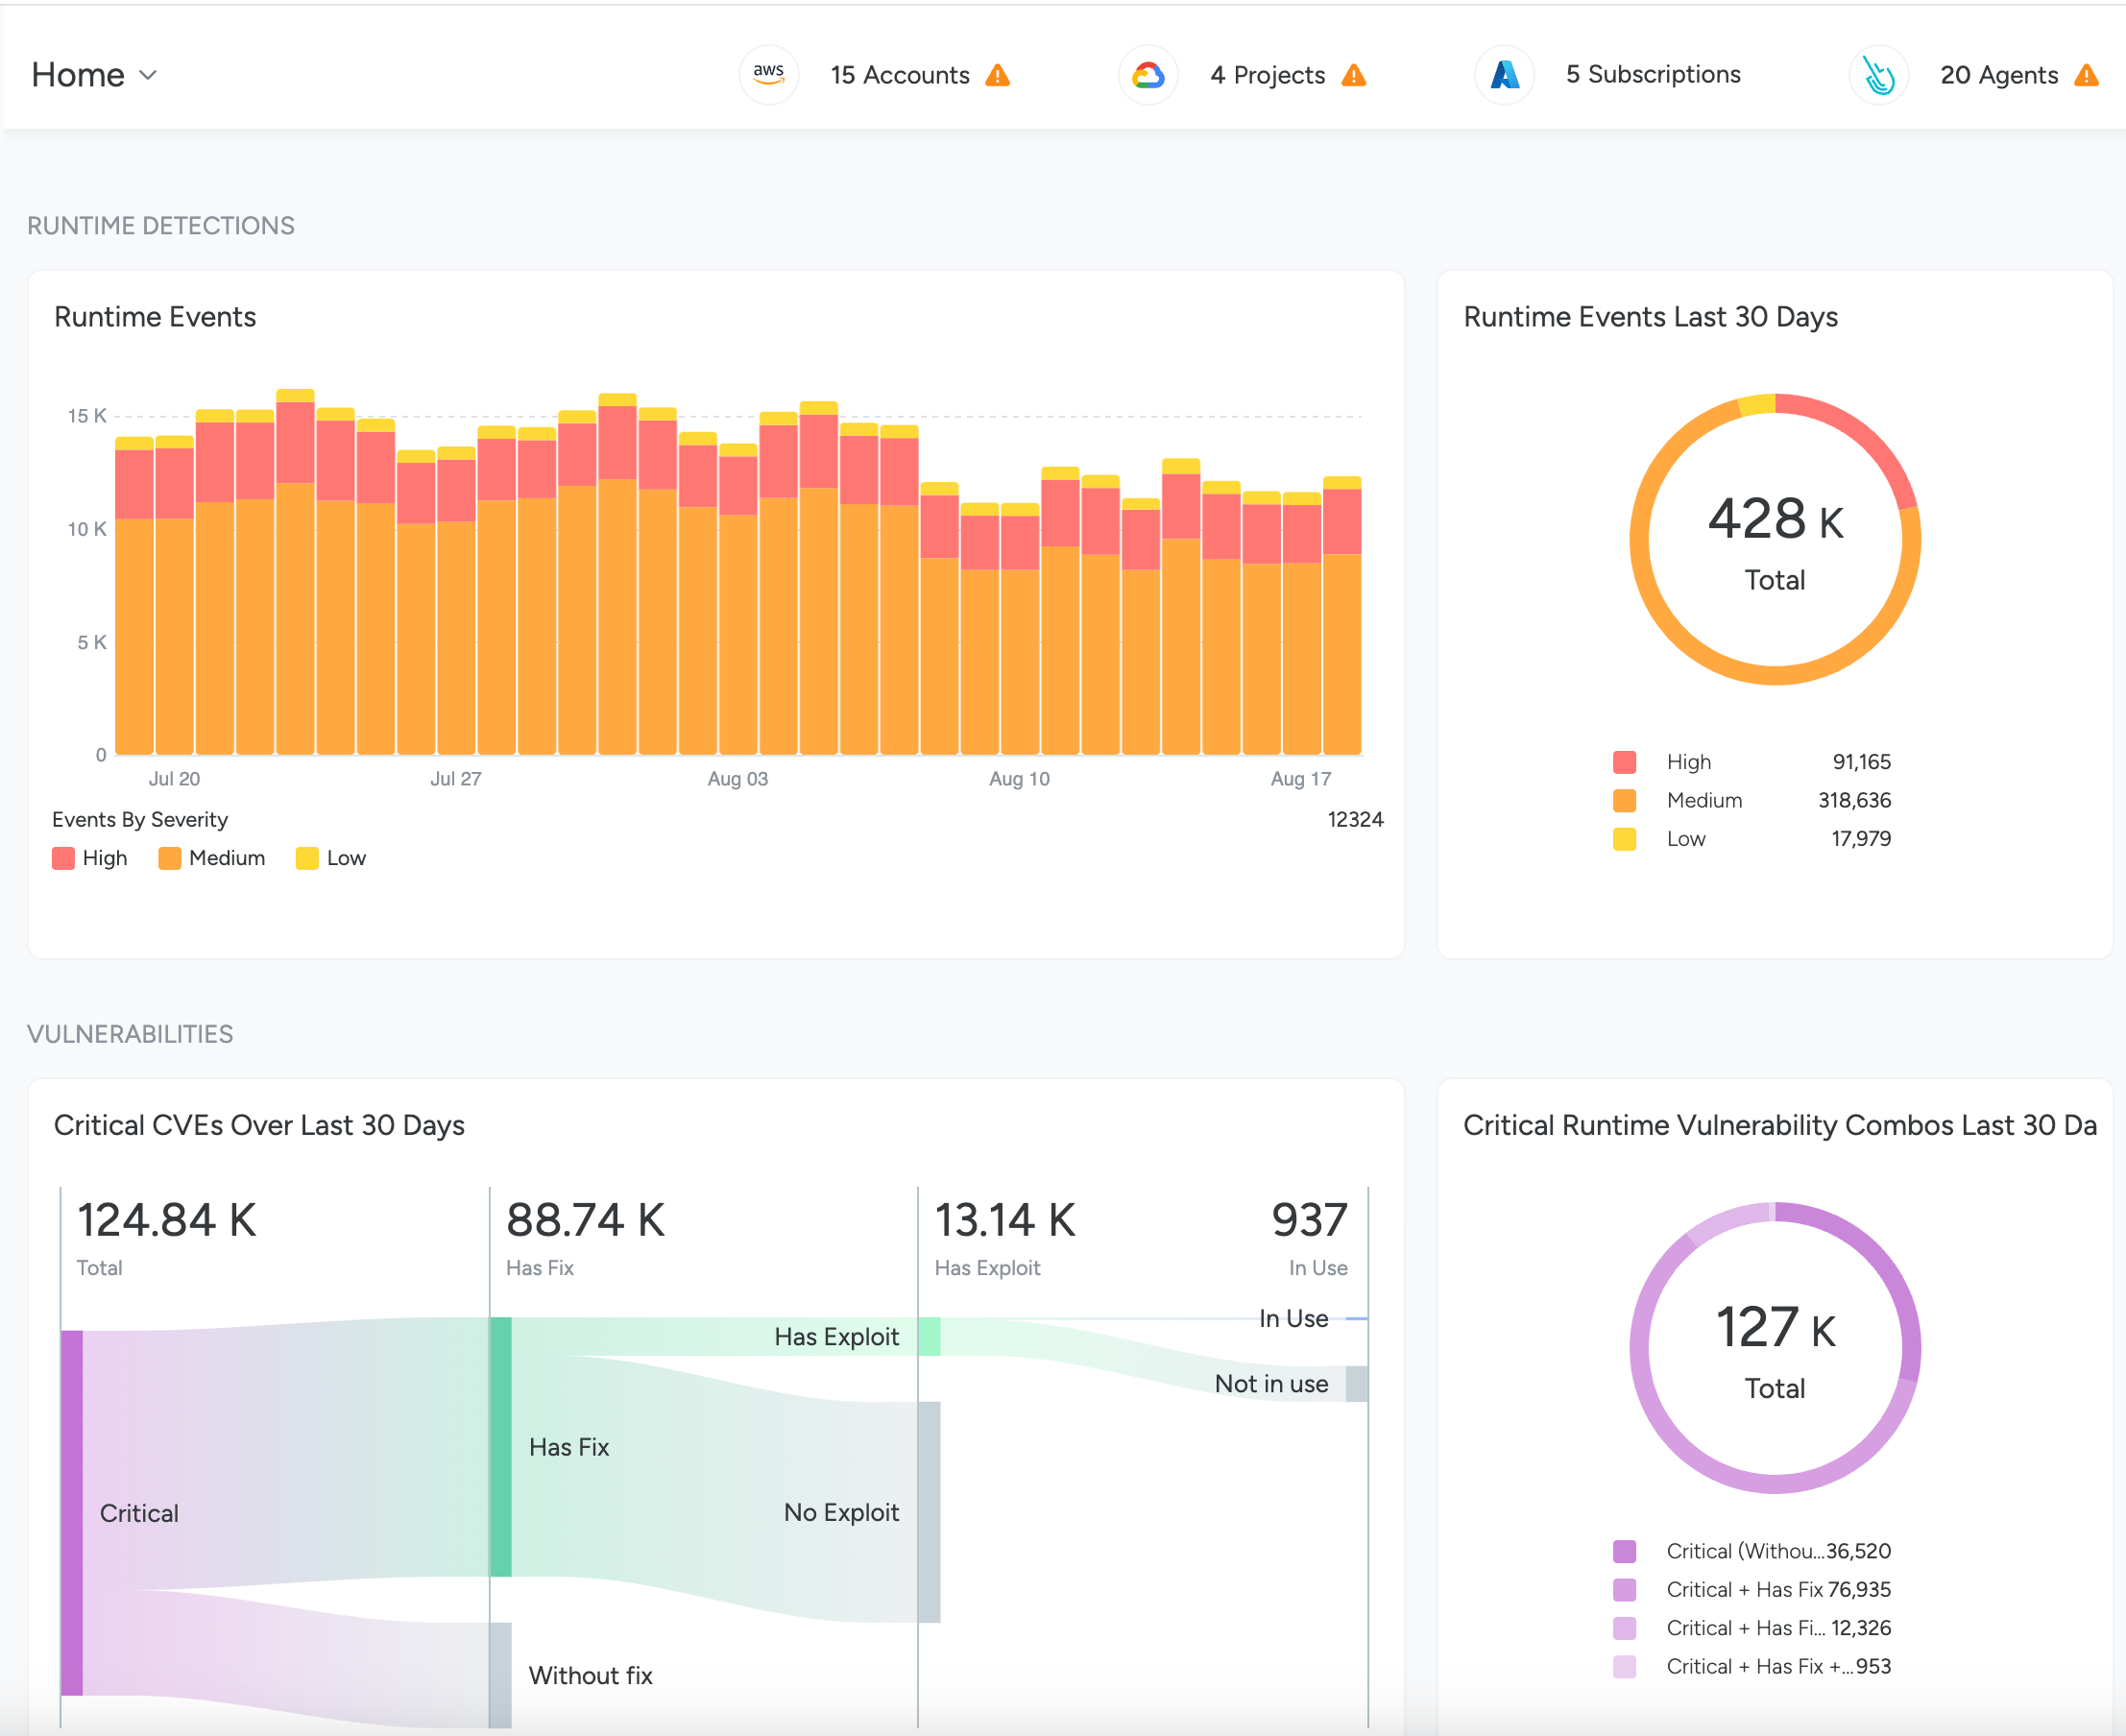
View Runtime Events
After you set up Threat Detection using either the Sysdig Agent or Agentless Threat Detection, you can view Runtime event trends broken down by Severity in this section.
Check Vulnerabilities
You can view various charts in this section based on the scanning you set up in your environment, such as:
- runtime scanner
- host scanner
- pipeline scanning
- registry scanning
- agentless scanning
The charts highlight the most critical vulnerabilities in your environment.
Posture
To view posture data, you should set up at least one of the following: CSPM, KSPM, or CIEM.
Depending on what is installed, you can view a breakdown of your evaluated resources by category, trends of unused permissions, poor identity hygiene practices, and trends of passing compliance requirements for your starred policies.
You can change starred policies/compliance trends on the Compliance page.
If you have not starred any policies as favorites, then the line graph displays the results from the three policies with the lowest passing scores.
