PromQL Query
To access the PromQL Query Explorer:
Log in to Sysdig Monitor.
Select Explore > PromQL Query.
The PromQL Query Explorer appears.
Query with PromQL
To query with PromQL in the PromQL Query Explorer:
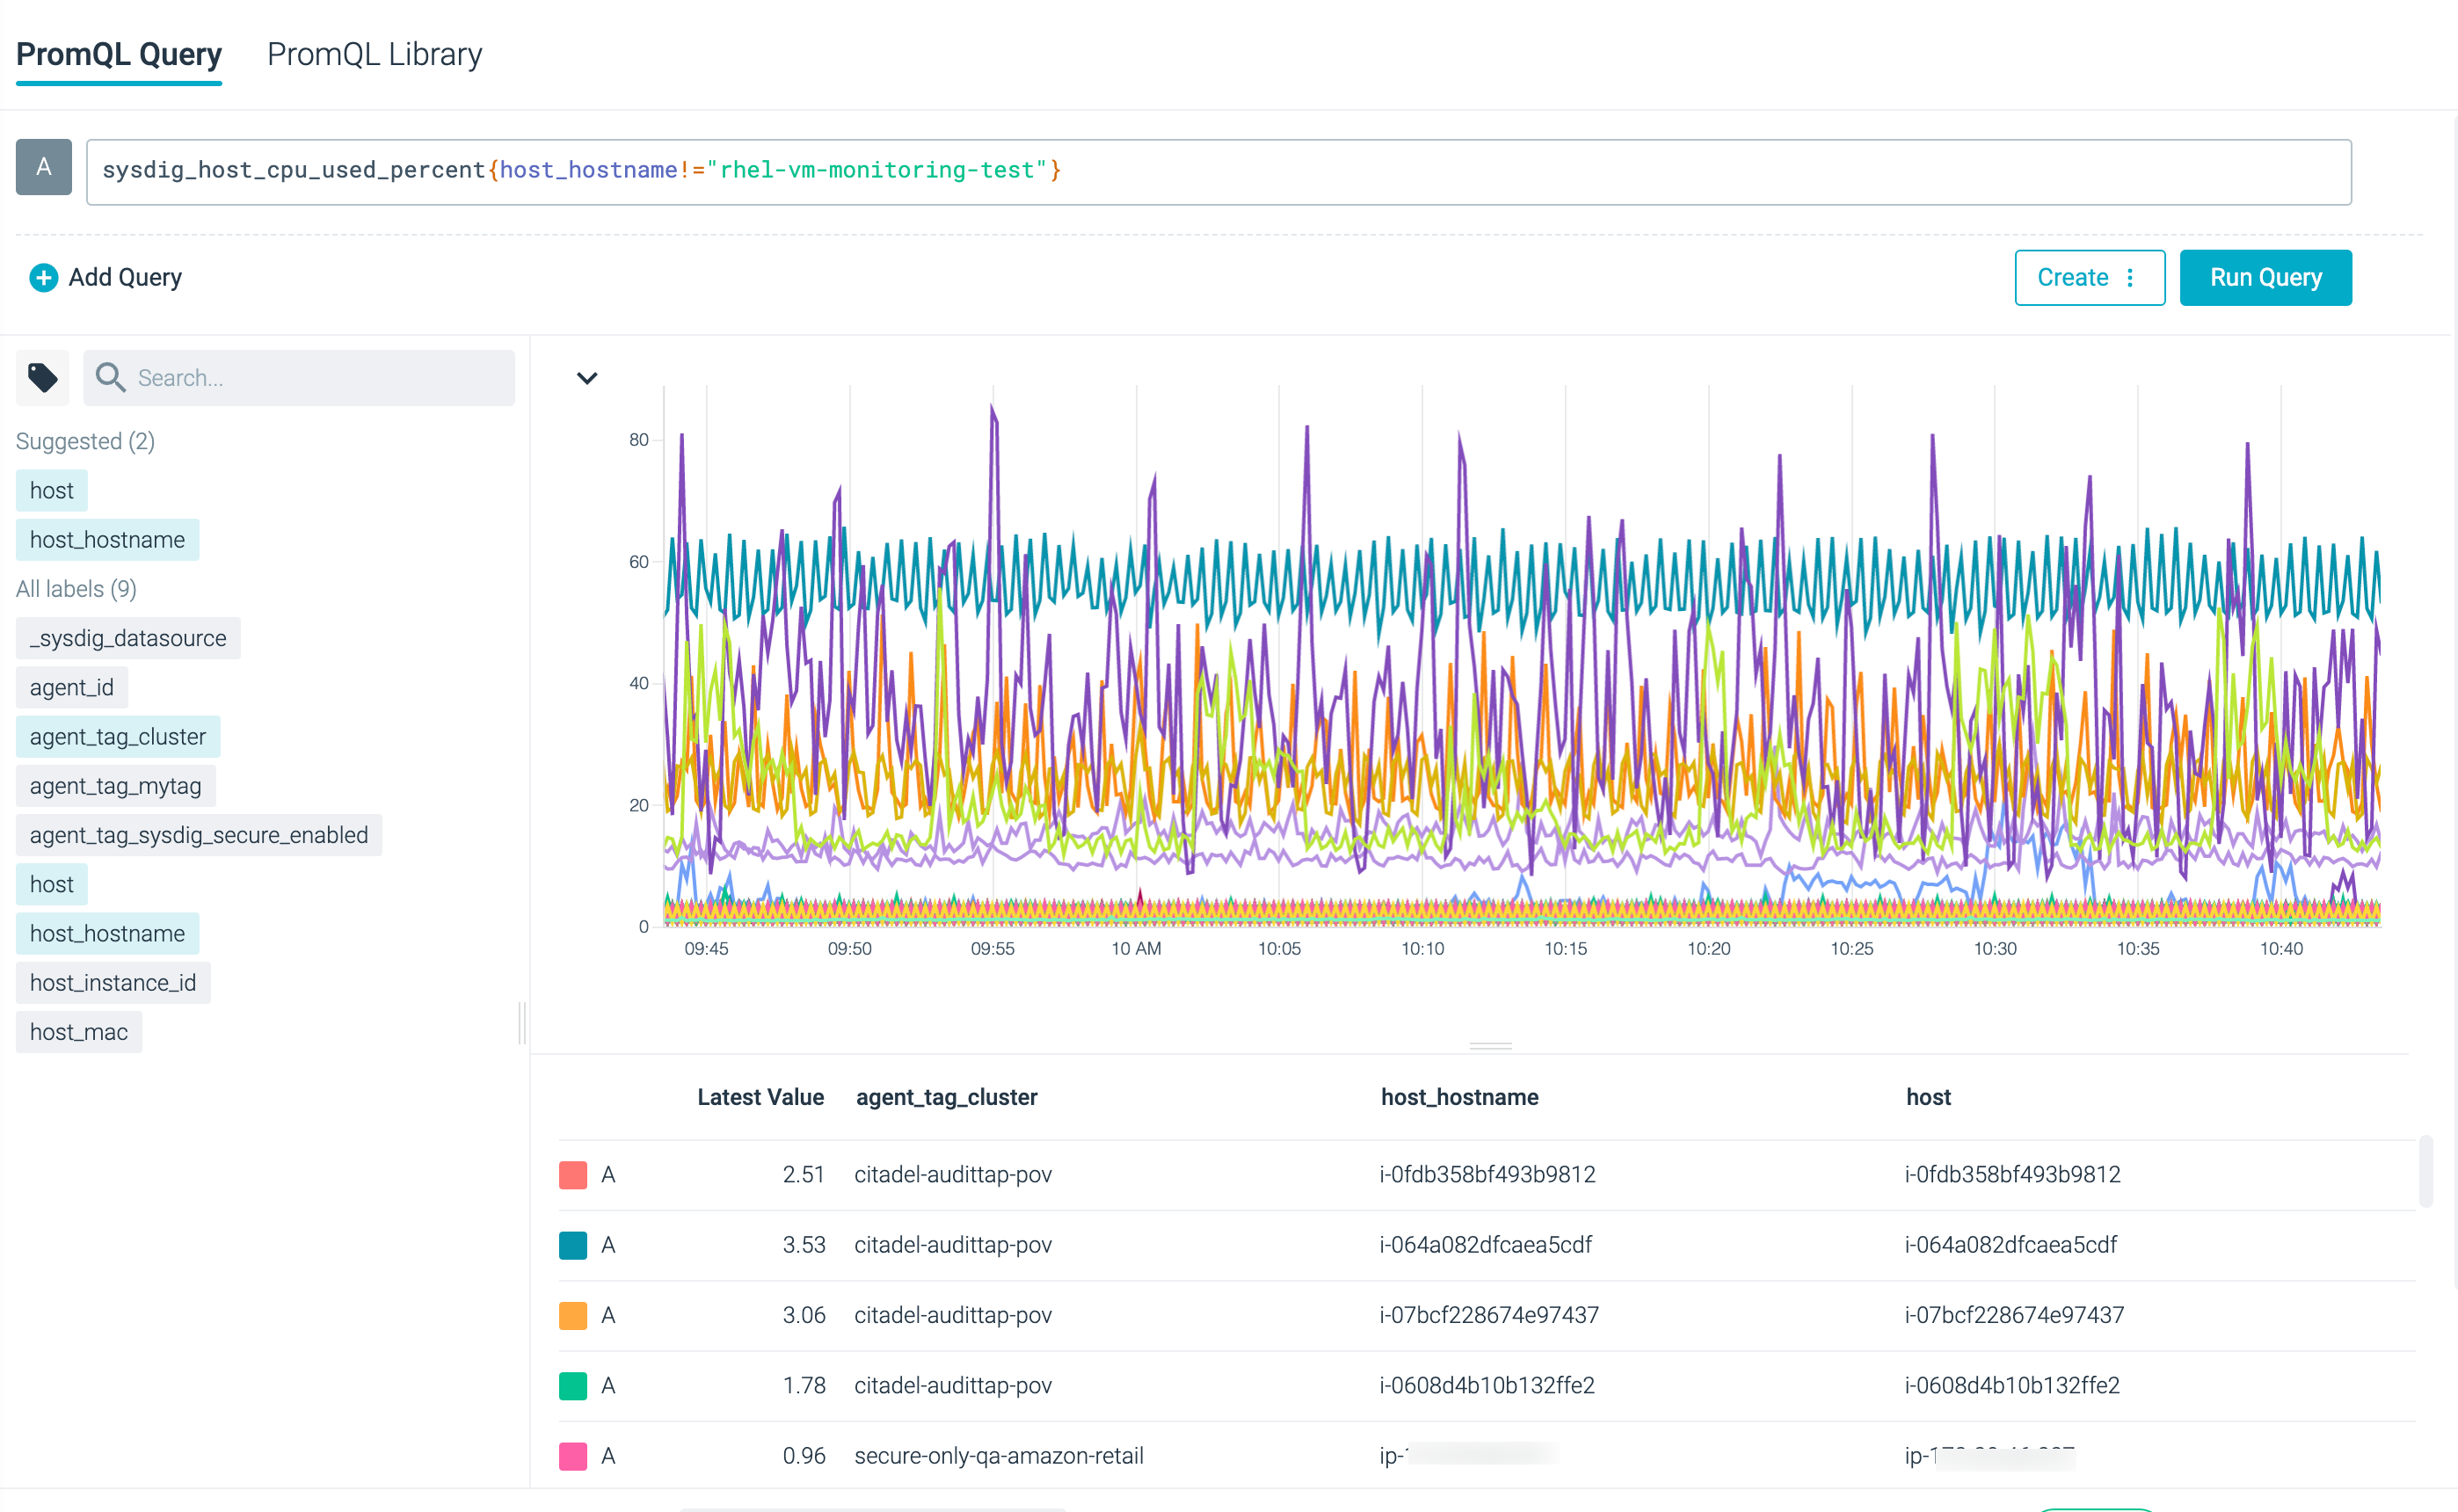
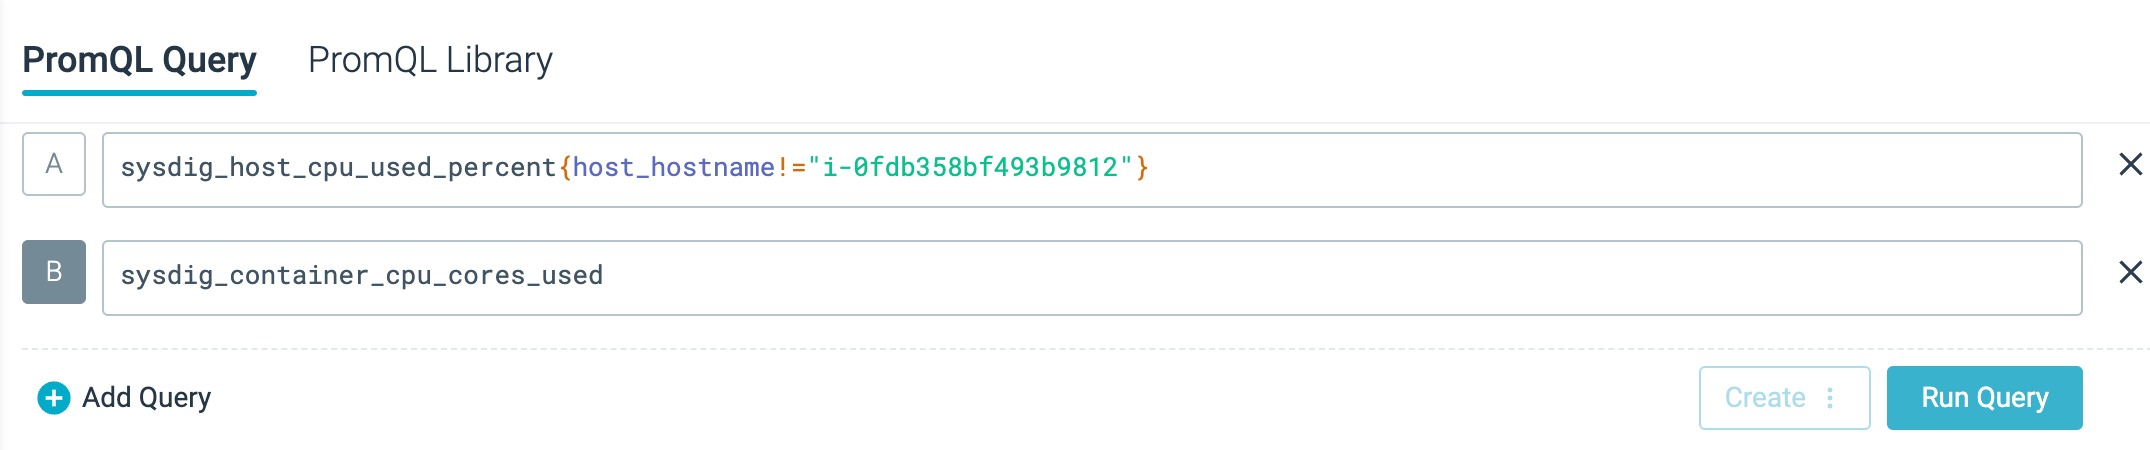
Manually build PromQL queries in the PromQL field. They can be as simple or as complex as you like.
Alternatively, to use a template, navigate to PromQL Library and select Try me on an out-of-the-box query.
After you populate the field with a query, select Run Query.
Optionally, select Create to build a dashboards or create alerts based on the query.
You can run up to five queries simultaneously in the PromQL Query Explorer.
Explore metrics and labels available in your infrastructure
For example, calculate the number of bytes received in a selected host:
sysdig_host_net_total_bytes{host_mac="0a:e2:e8:b4:6c:1a"}
Calculate the number of bytes received in all the hosts except one:
sysdig_host_net_total_bytes{host_mac!="0a:a3:4b:3e:db:a2"}
Compare current data with historical data:
sysdig_host_net_total_bytes offset 7d
Use arithmetic operators to perform calculations on one or more metrics or labels
For example, calculate the rate of incoming bytes and convert it to bits:
rate(sysdig_host_net_total_bytes[5m]) * 8
Build complex PromQL queries
For example, return summary ingress traffic across all the network interfaces grouped by instances
sum(rate(sysdig_host_net_total_bytes[5m])) by (container_id)
Label Filtering
| Steps | Preview |
|---|---|
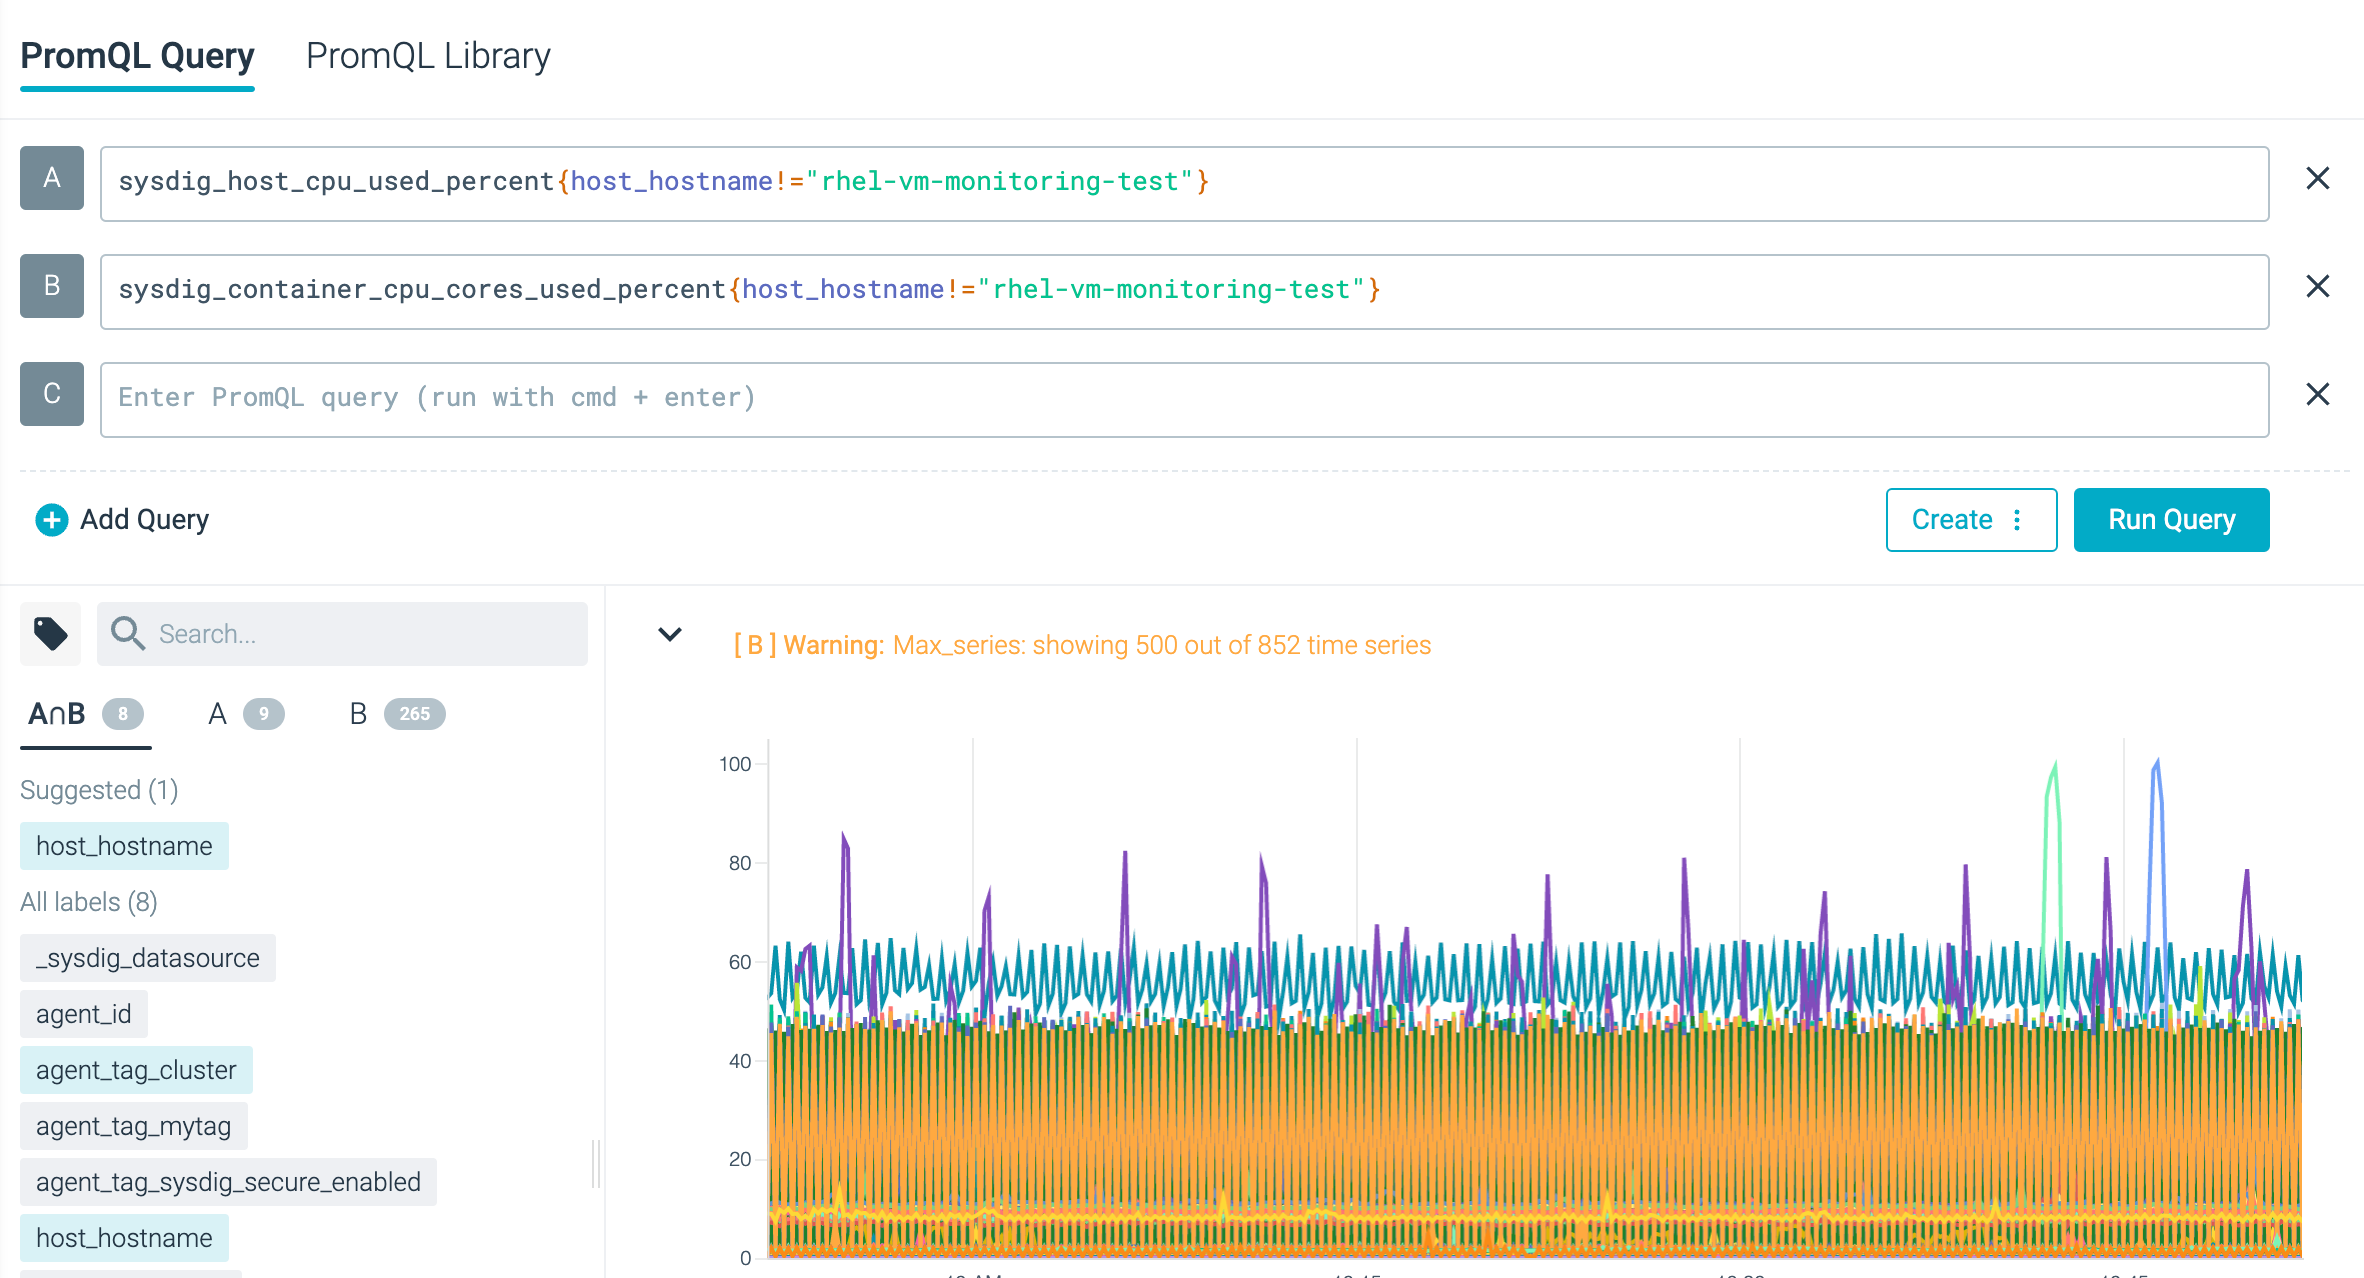
Label filtering to automatically identify common labels between queries for vector matching. In the given example, you can see that A and B queries have 8 labels in common as highlighted in the [A∩B] section. |
|
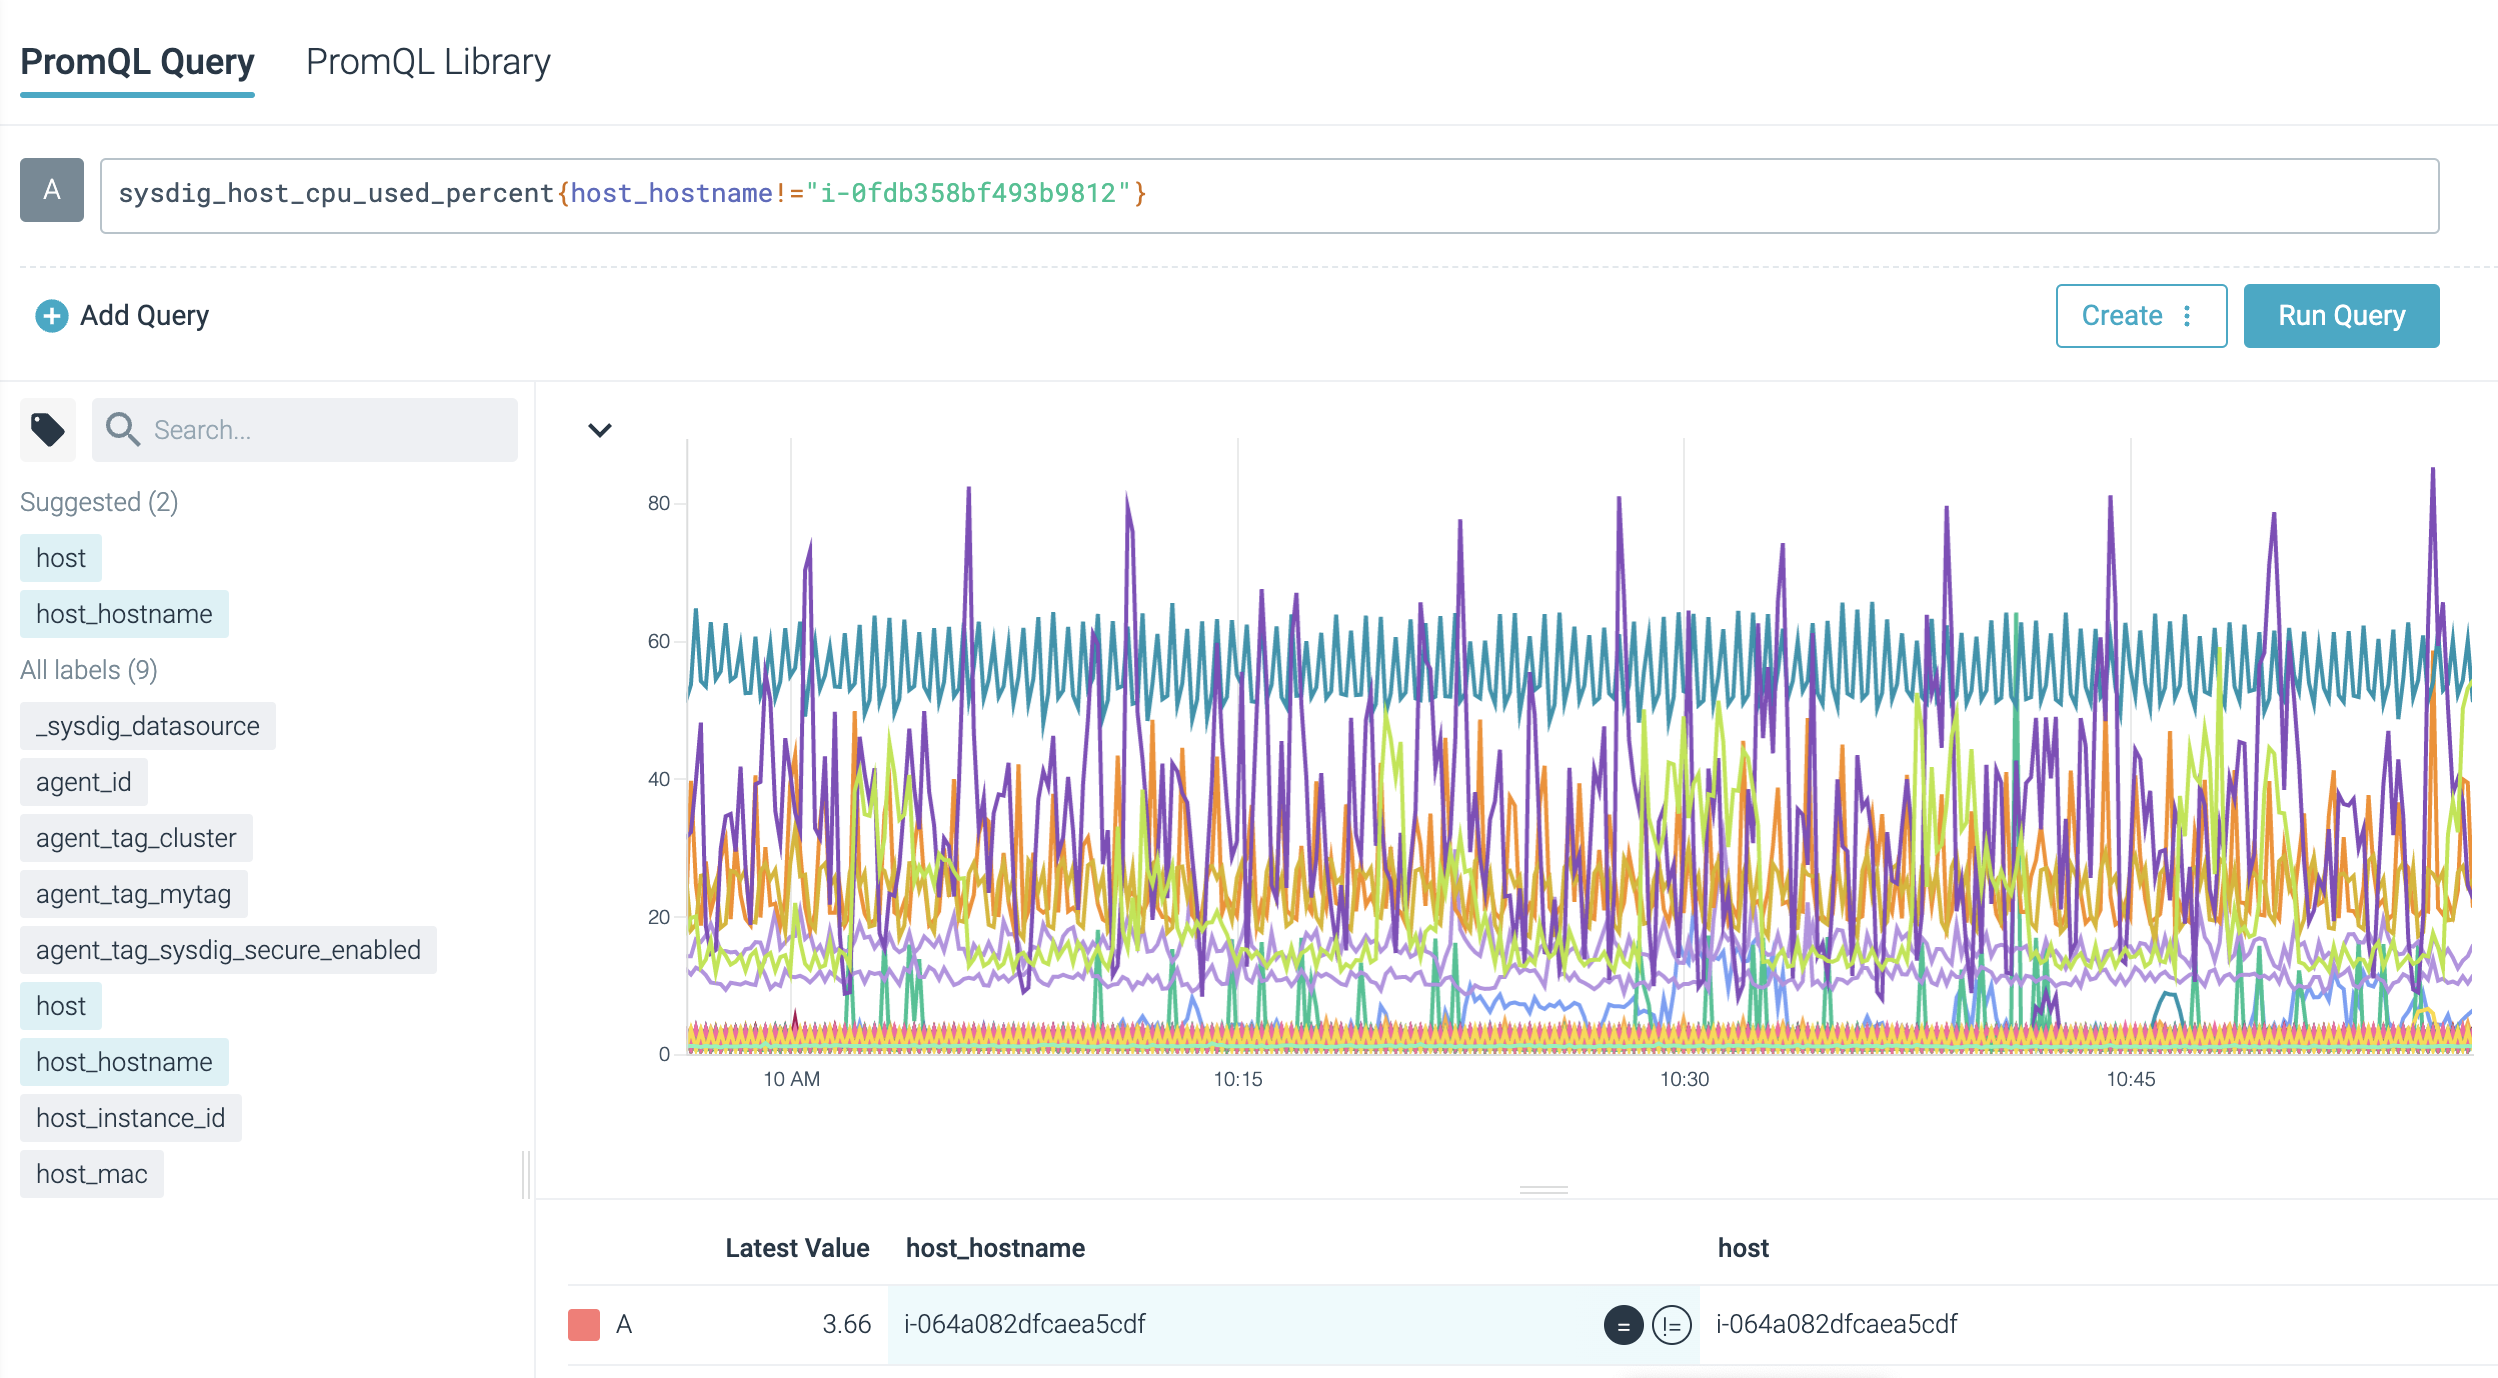
| Filter by using the relational operators available in the time series table. Simply click the operator for it to be automatically applied to the queries. Run the queries again to visualize the metrics. |
|
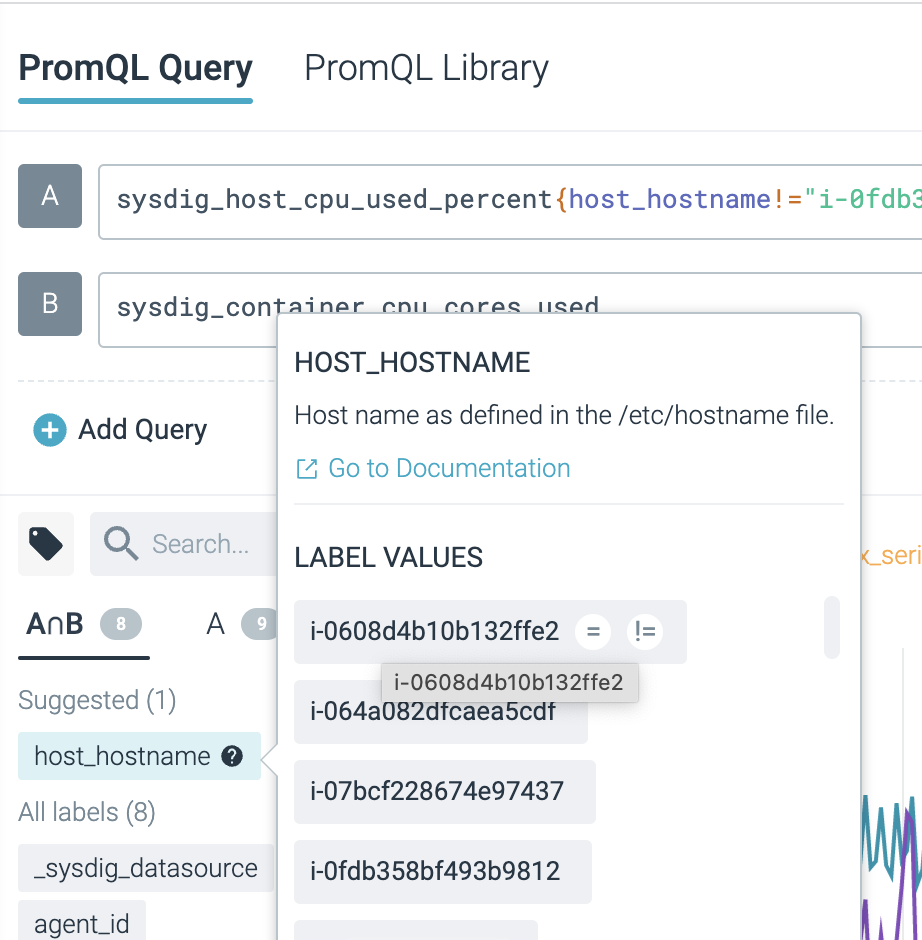
| Explore labels, view documentation, and perform filtering by using rational operators from the label selector. |
|
Toggle Query Results
| Steps | Preview |
|---|---|
| Click the respective query buttons, for example, A or B, to show or hide query results. |
|
Learn More
To take the exploration further, you can:
- Create an Alert that enables you to craft a Prometheus Alert based on one of the selected queries.
- Create Dashboard Panel which lets you add the selected metrics to a new dashboard panel.