Metrics Explorer
To access Metrics Explorer:
Log in to Sysdig Monitor as a Standard User or higher.
Select Explore > Metrics Explorer.

Filter Infrastructure & Metrics
You can explore the infrastructure stack and get insight into the numerous metrics available to you at each level. To find these displays, select a top-level infrastructure object, then filter by scope for relevant infrastructure objects, or filter by metrics for desired metrics.
Sysdig Monitor displays only the metrics and dashboards that are relevant to the selected infrastructure object.
| Steps | Preview |
|---|---|
On the Metrics Explorer tab, open the infrastructure filtering menu and select the infrastructure object you want to explore. (demo-kube-gke in the example) |
|
Navigate to Filter metrics and search or select the desired metric. (memory_bytes in the example).The metric will instantly be presented as a time chart. The scope of the metric, when viewed via the scope filtering menu, is set to the infrastructure object that you have currently selected. |
|
| Multiple queries can be added either via the Metric list of by clicking on Add Query. |
|


Groupings
Groupings provides a hierarchical view of an infrastructure entities. With Groupings, you can segment your infrastructure by any label. You can use out-of-the-box groupings or create your own.
Sysdig Monitor offers two types of Groupings:
Switch Groupings
To switch between available groupings follow the steps outlined below.
| Step | |
|---|---|
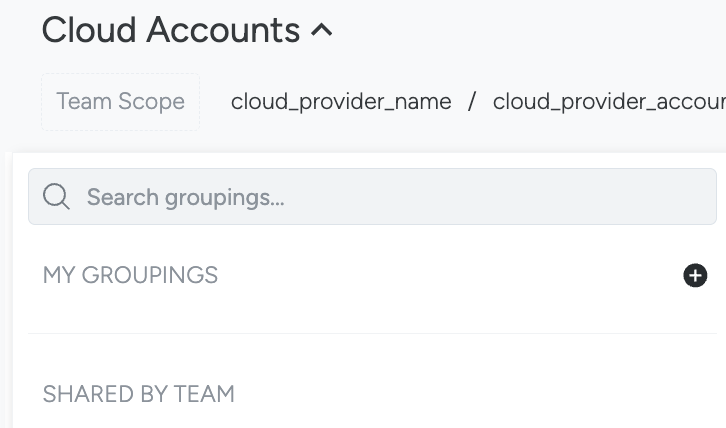
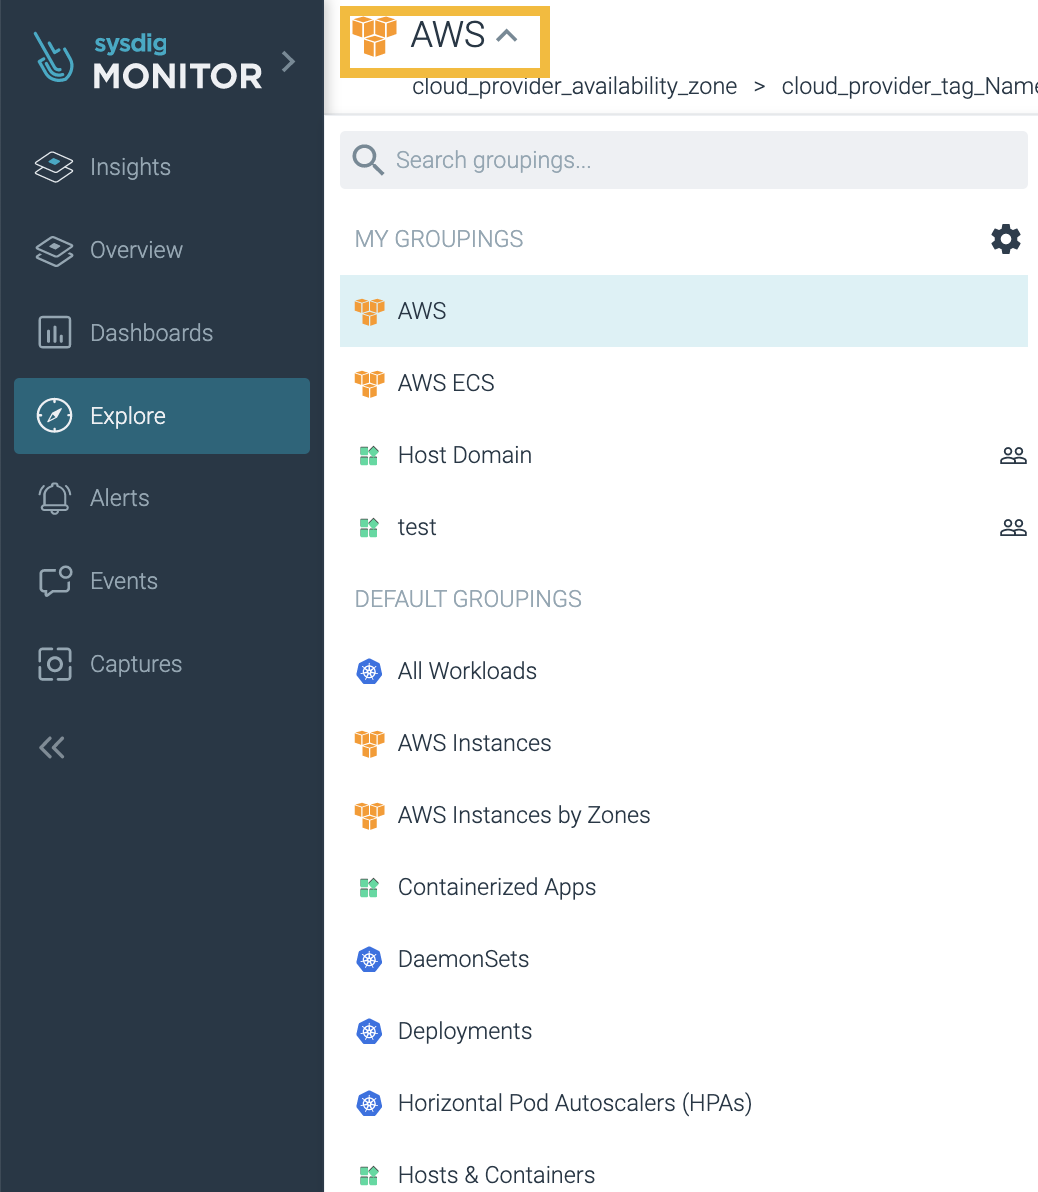
| On the Metrics Explorer page, select the name of the current Grouping (for example, Cloud Accounts) at the top of the page. |
|
| The Groupings menu appears. Select the desired grouping from the list. |
|
Create a Grouping
| Step | Preview |
|---|---|
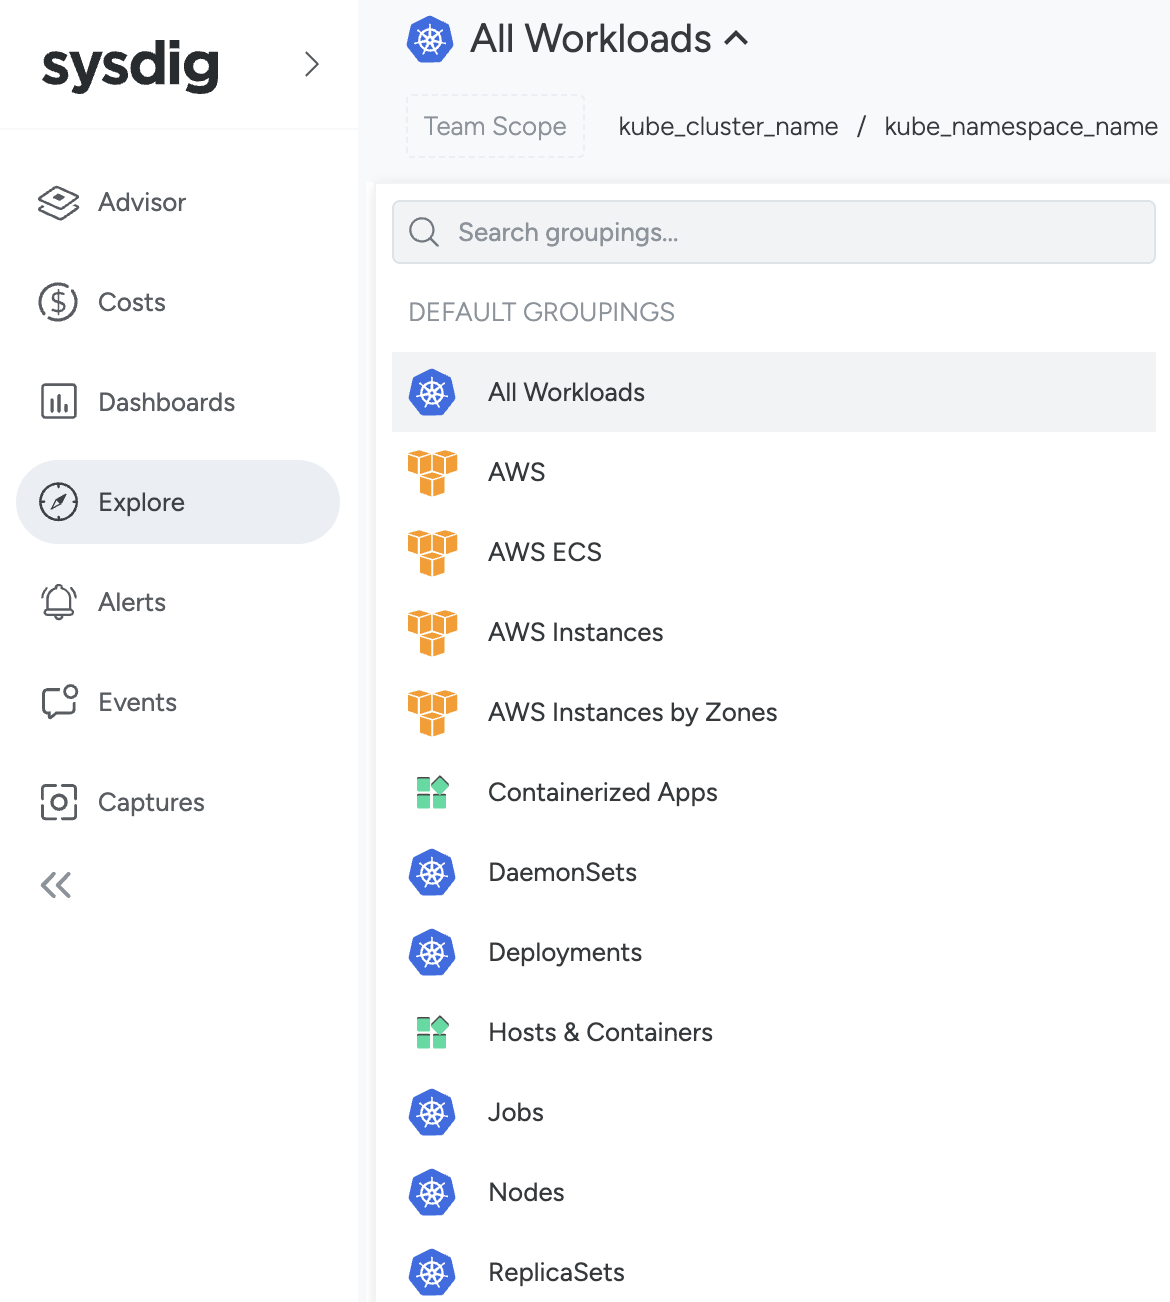
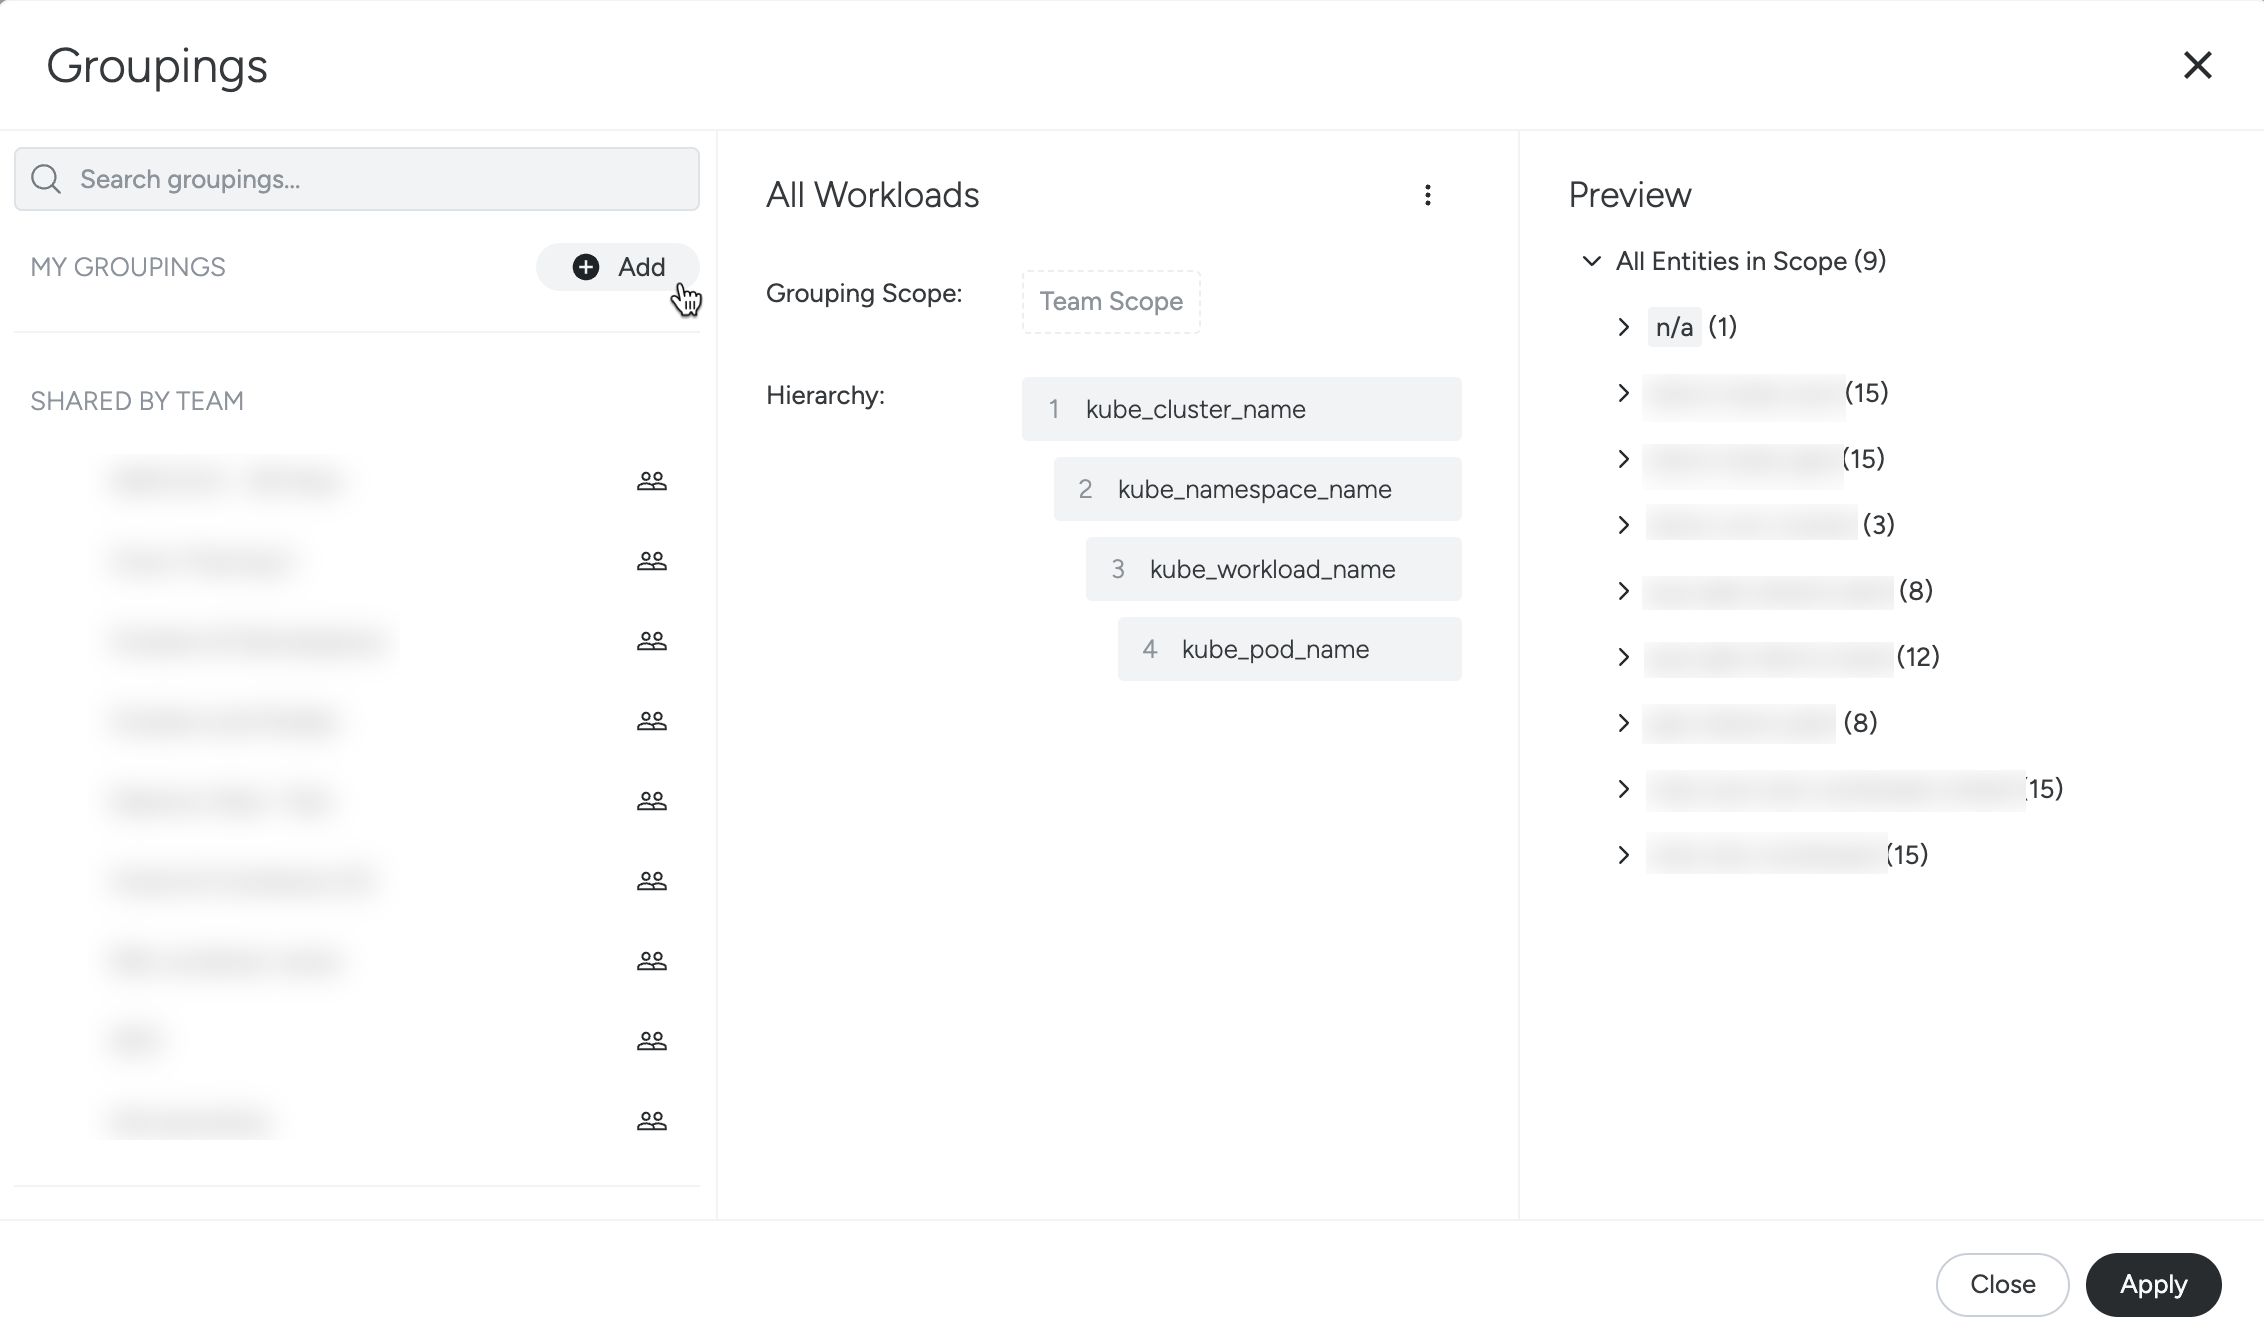
| On the Metrics Explorer page, select the current Grouping (for example, My Workloads) to open the Groupings menu. |
|
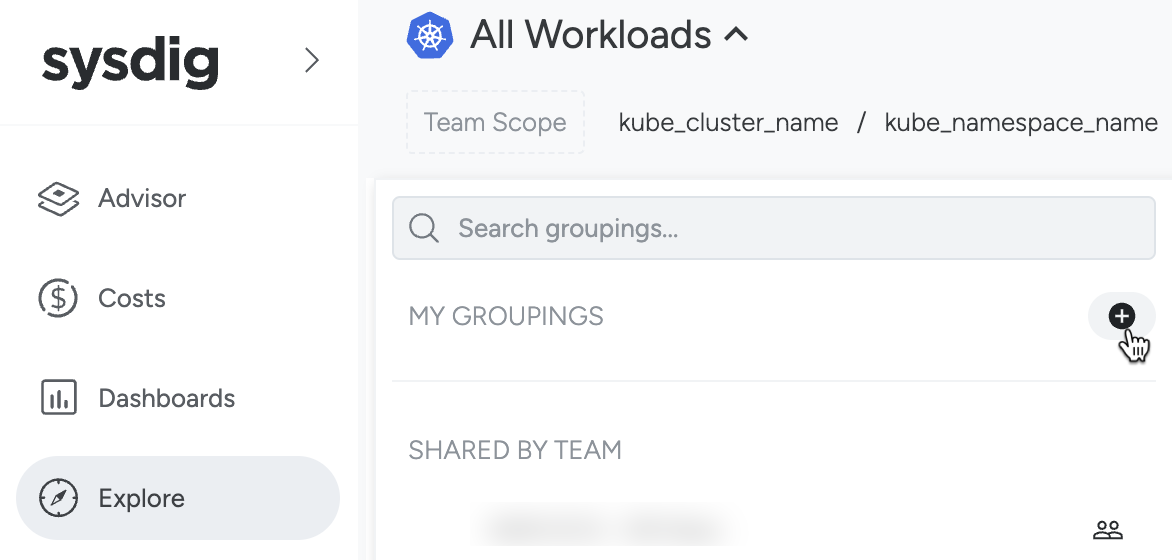
| Beside the My Groupings section, select the + icon. |
|
| In the new modal, click Add. |
|
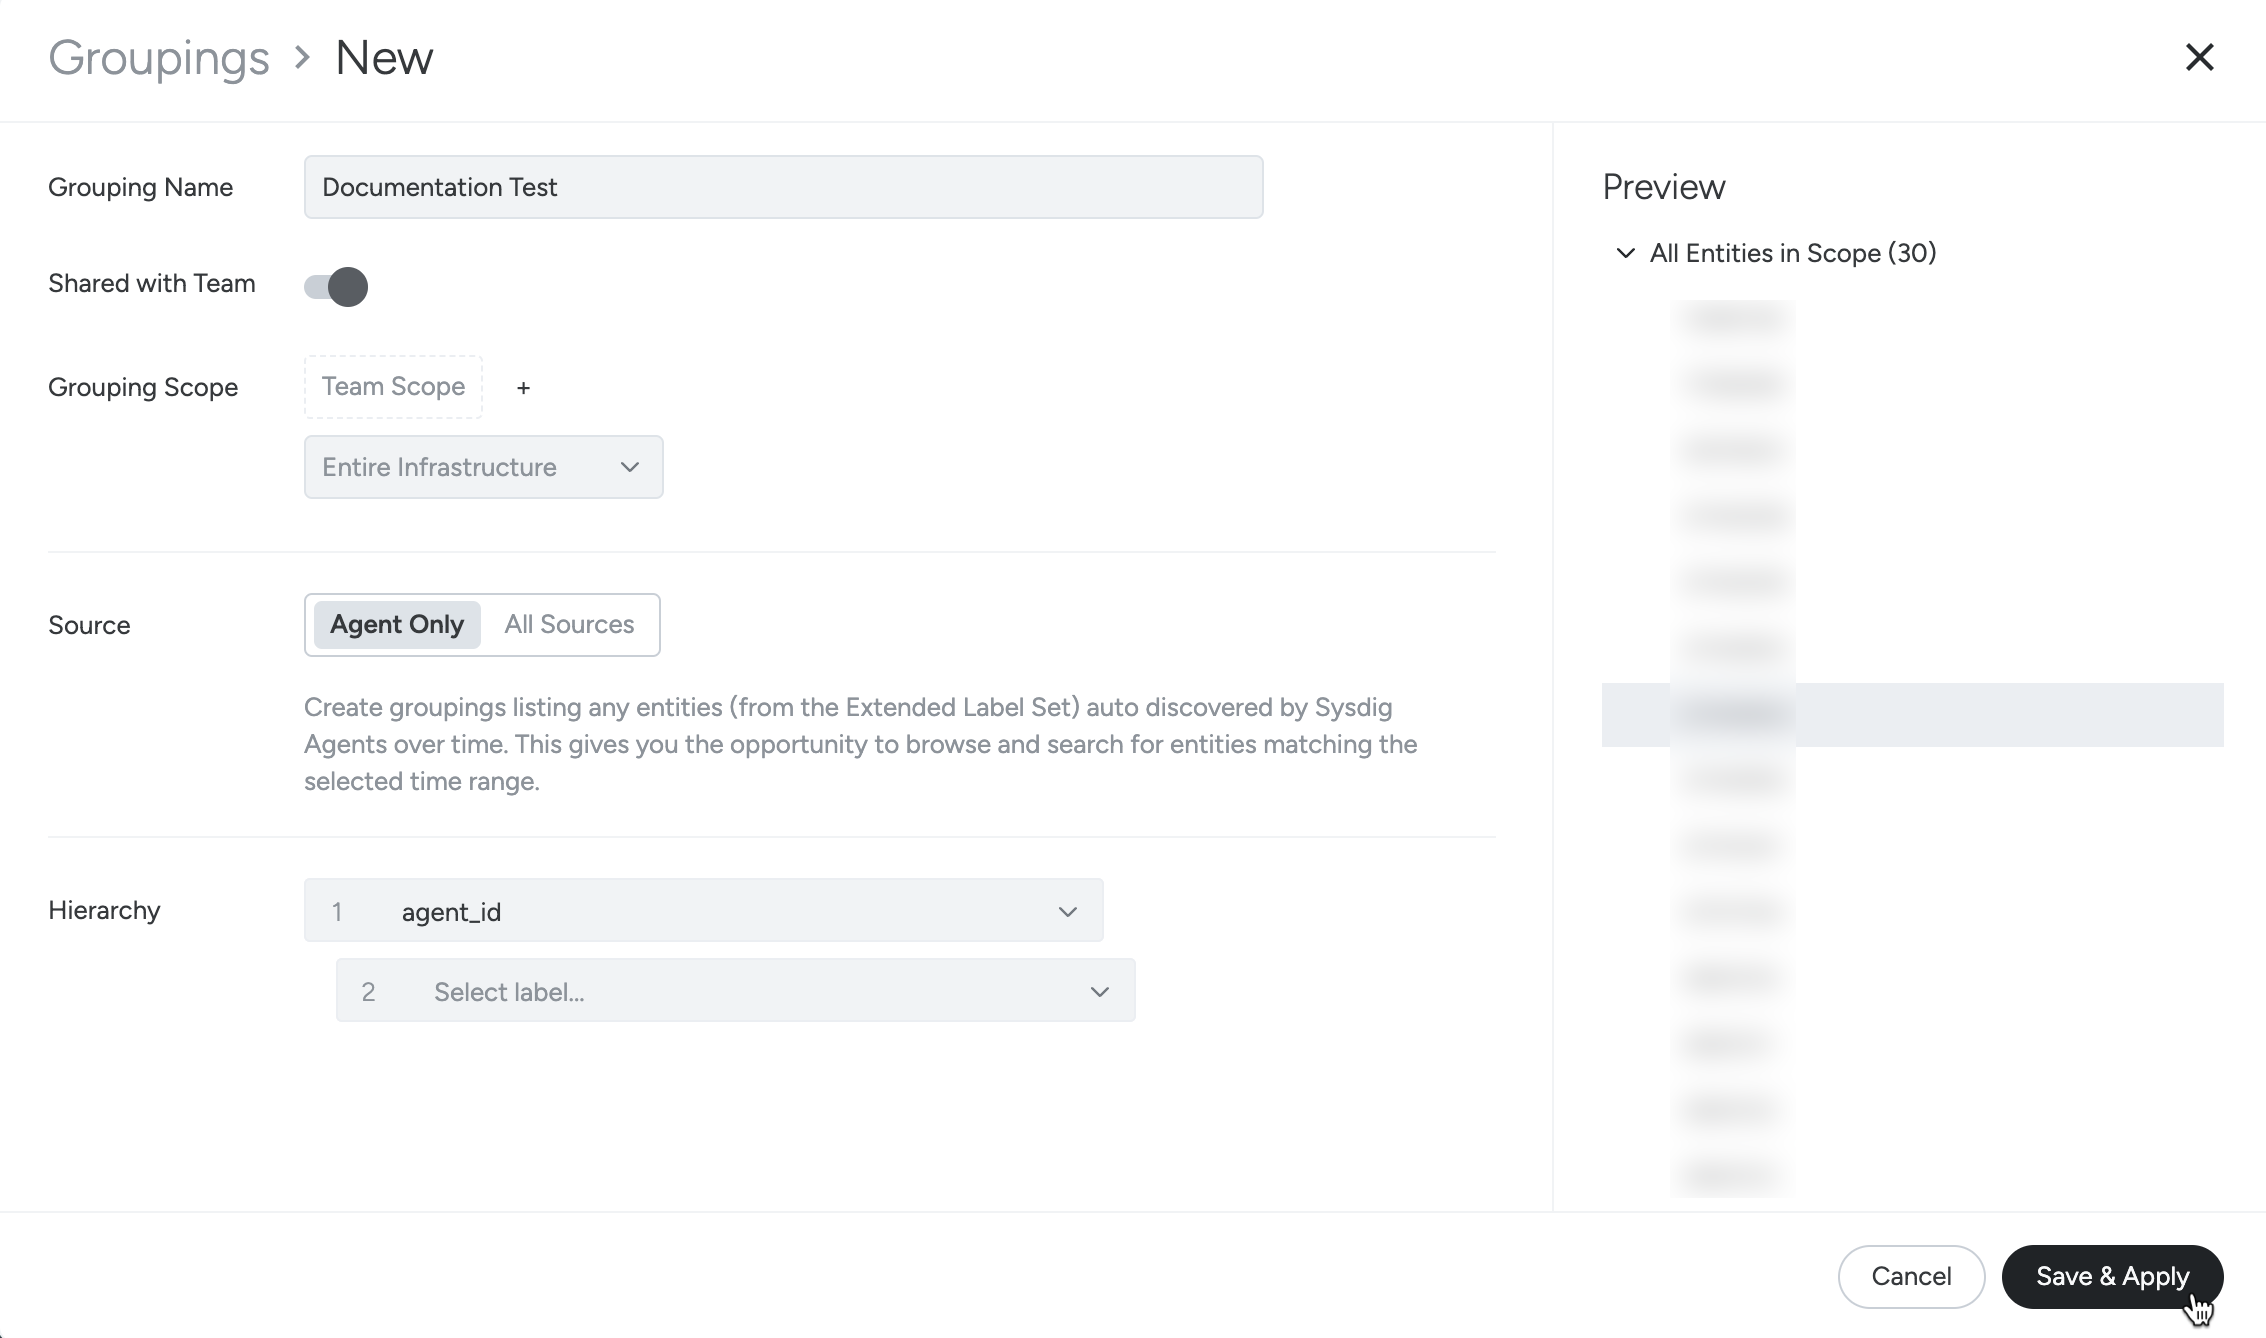
| Specify your Grouping Name, sharing settings, Scope, Source, and grouping Hierarchy. Click Save & Apply. |
|
Define Groupings
Scope
When creating a grouping, you can specify a scope to restrict which entities will be considered when populating the Hierarchy.
For example, defining a grouping that only displays Cronjobs. In the scenario given below, kube_workload_type is cronjob is added as a Scope filter.

The filter then ensures that the only workloads displayed in the Hierarchy are Cronjobs.

Sources
You can use two sources when defining a grouping.
| Groupings | Label source | Data used |
|---|---|---|
| Agent Only | Any label from Extended Label Set (also known as Service Vision), emitted by any Sysdig Agent. | Historical data in accordance to the time window selected. |
| All Sources | Any label, regardless of source. | Real-time only (last 10-40 mins). |
Agent Only
Agent Only Groupings are the oldest type of Groupings in Sysdig Monitor. They use any extended label emitted by any Sysdig Agent to build the infrastructure tree. These groupings accurately reflect the state of your infrastructure as the time navigation is shifted back in time. The most commonly used agent-only grouping is All Workloads, which organizes the infrastructure entities by the following labels: kube_cluster_name, kube_namespace_name, kube_workload_name, and kube_pod_name.

All Sources
All Sources Groupings allow you to use any label to build the infrastructure tree, regardless of the source. This makes them more flexible than the agent-only groupings. An example of an all-sources groupings is Azure Resources, which organizes the entities by the following labels: subscription_name, cloud_provider_region_name, resource_group, and cloud_provider_resource_name.
All Sources Groupings solely use real-time data from the last 10 to 40 minutes.