Review Events
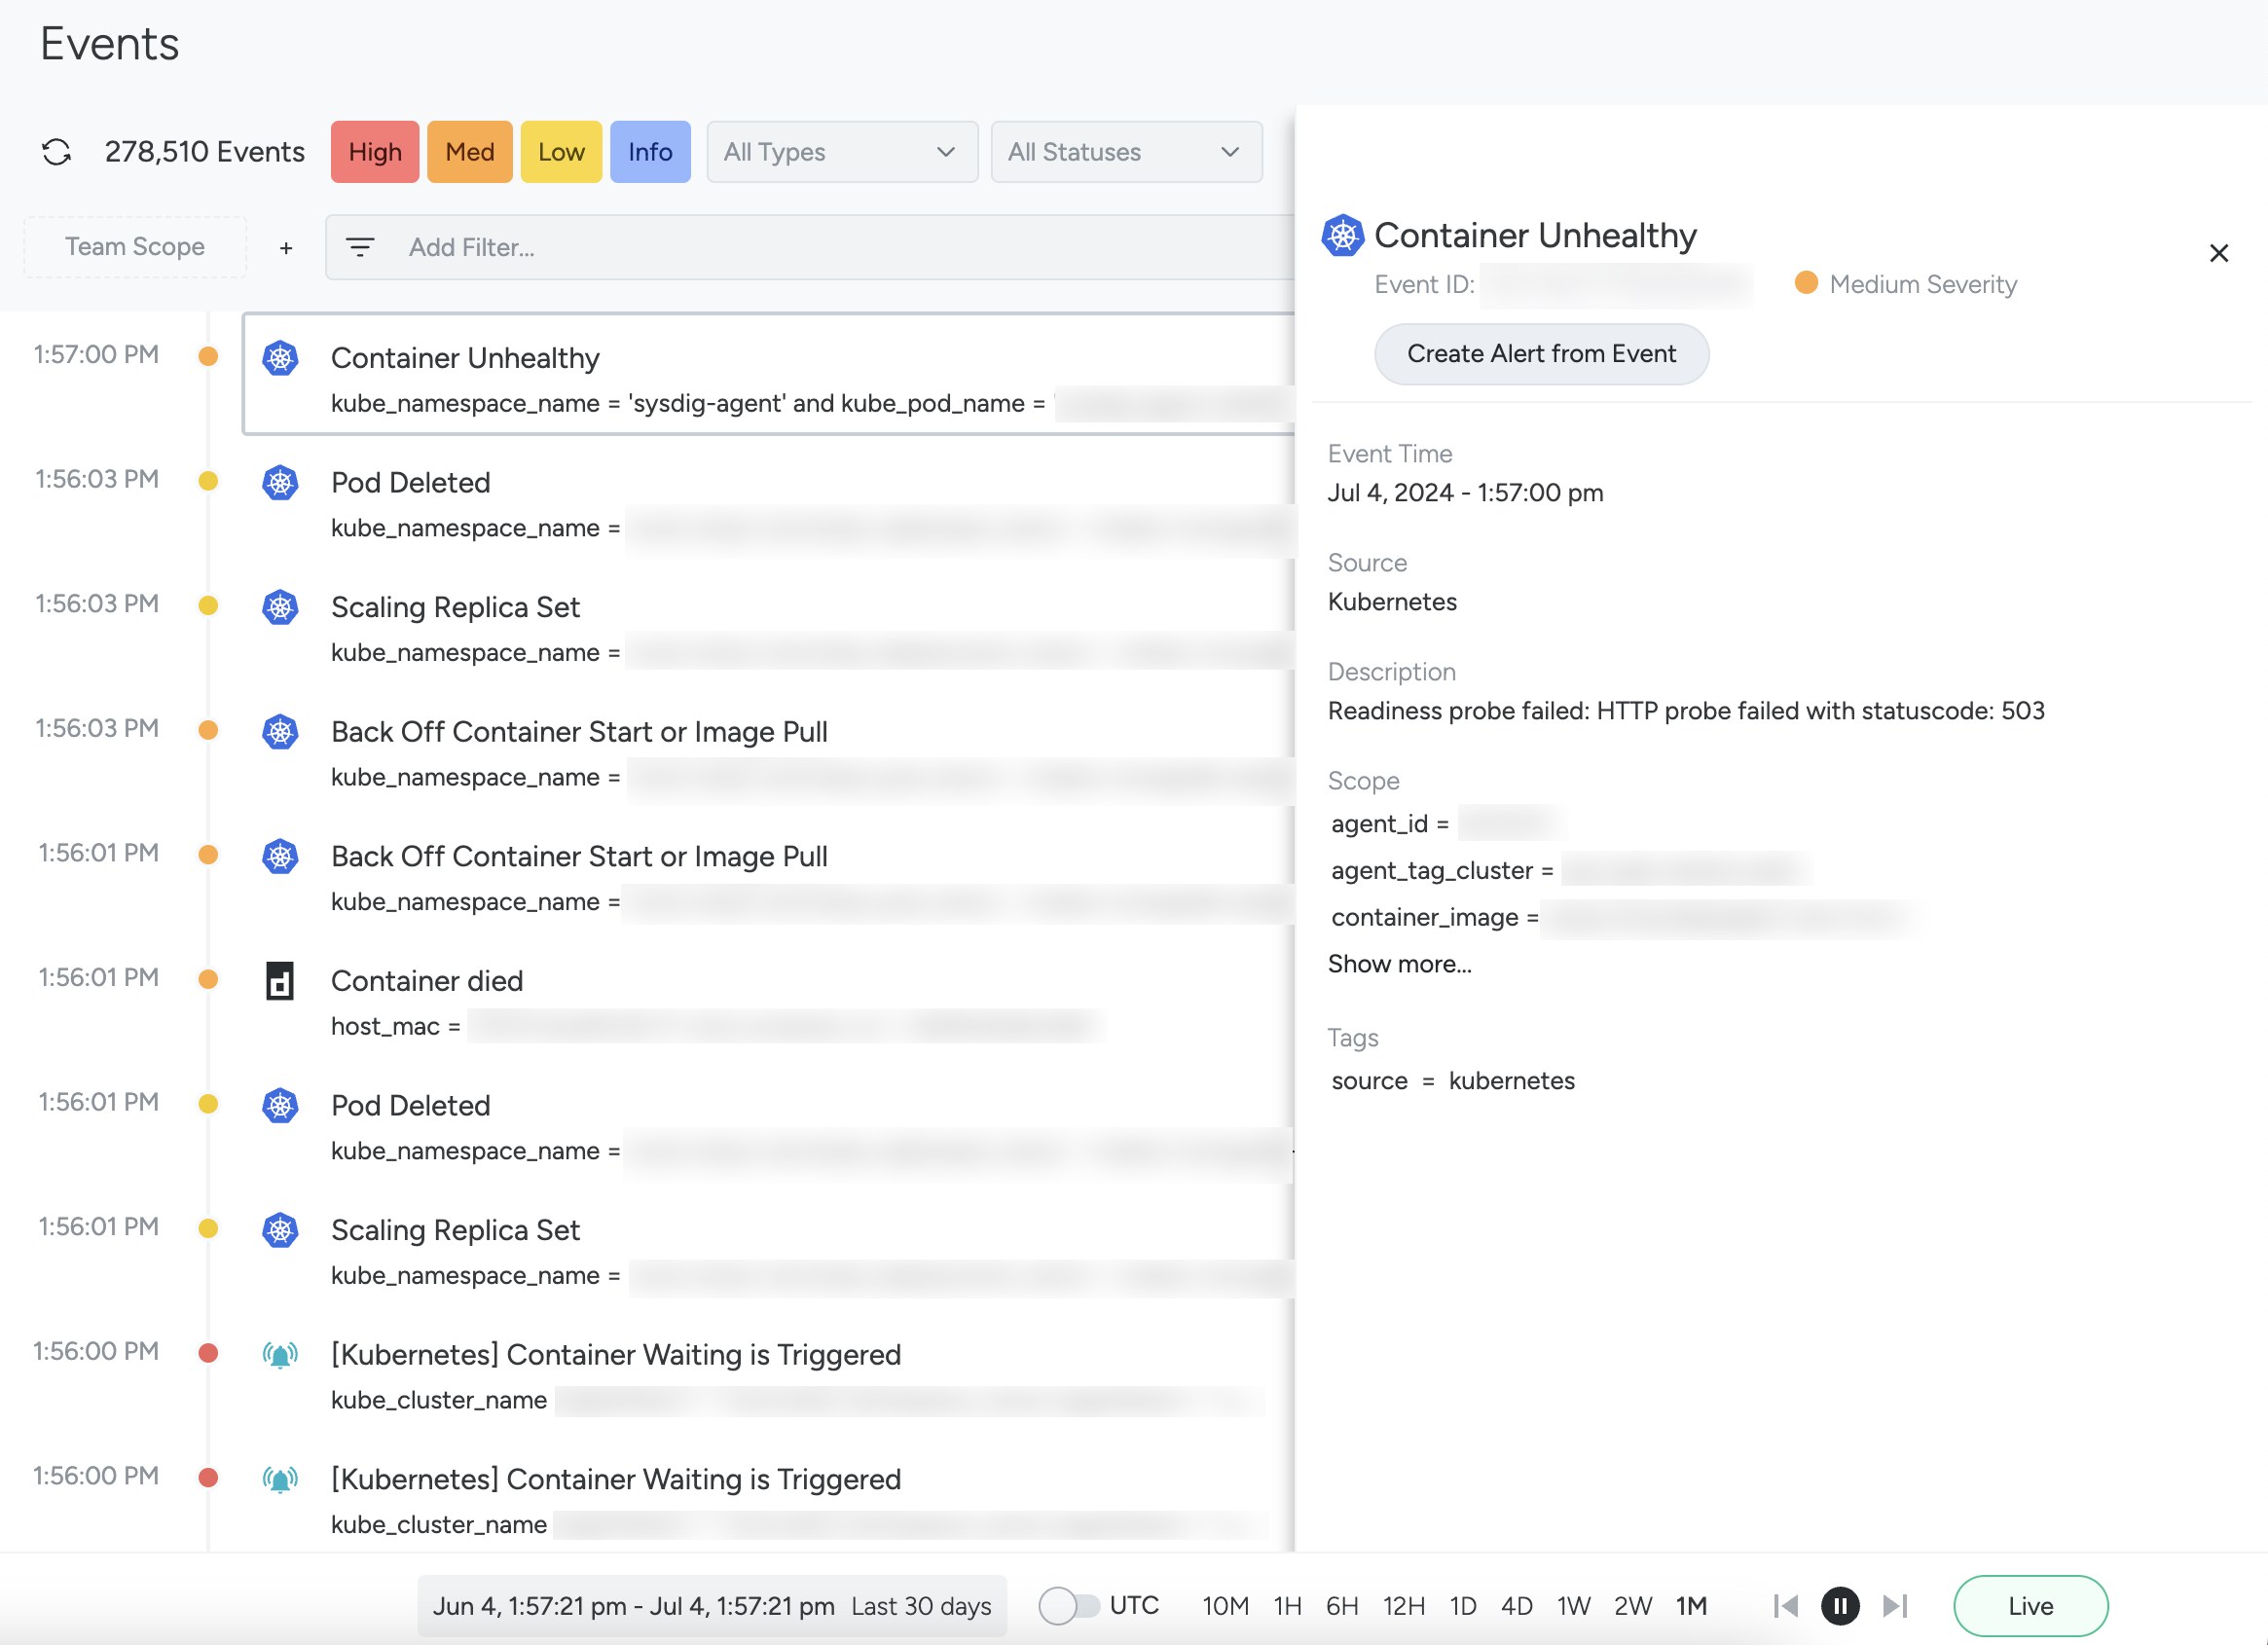
The Event Details panel is displayed on the right side of the screen.
Here you can see detailed information about the event, such as the time of occurrence, and details of its exact location in your infrastructure.
The Event Details Panel
The Event Details panel contains detailed information about the event. The details shown depend depend on the event type. Details will vary between Alert, Custom, Container, and Kubernetes events.
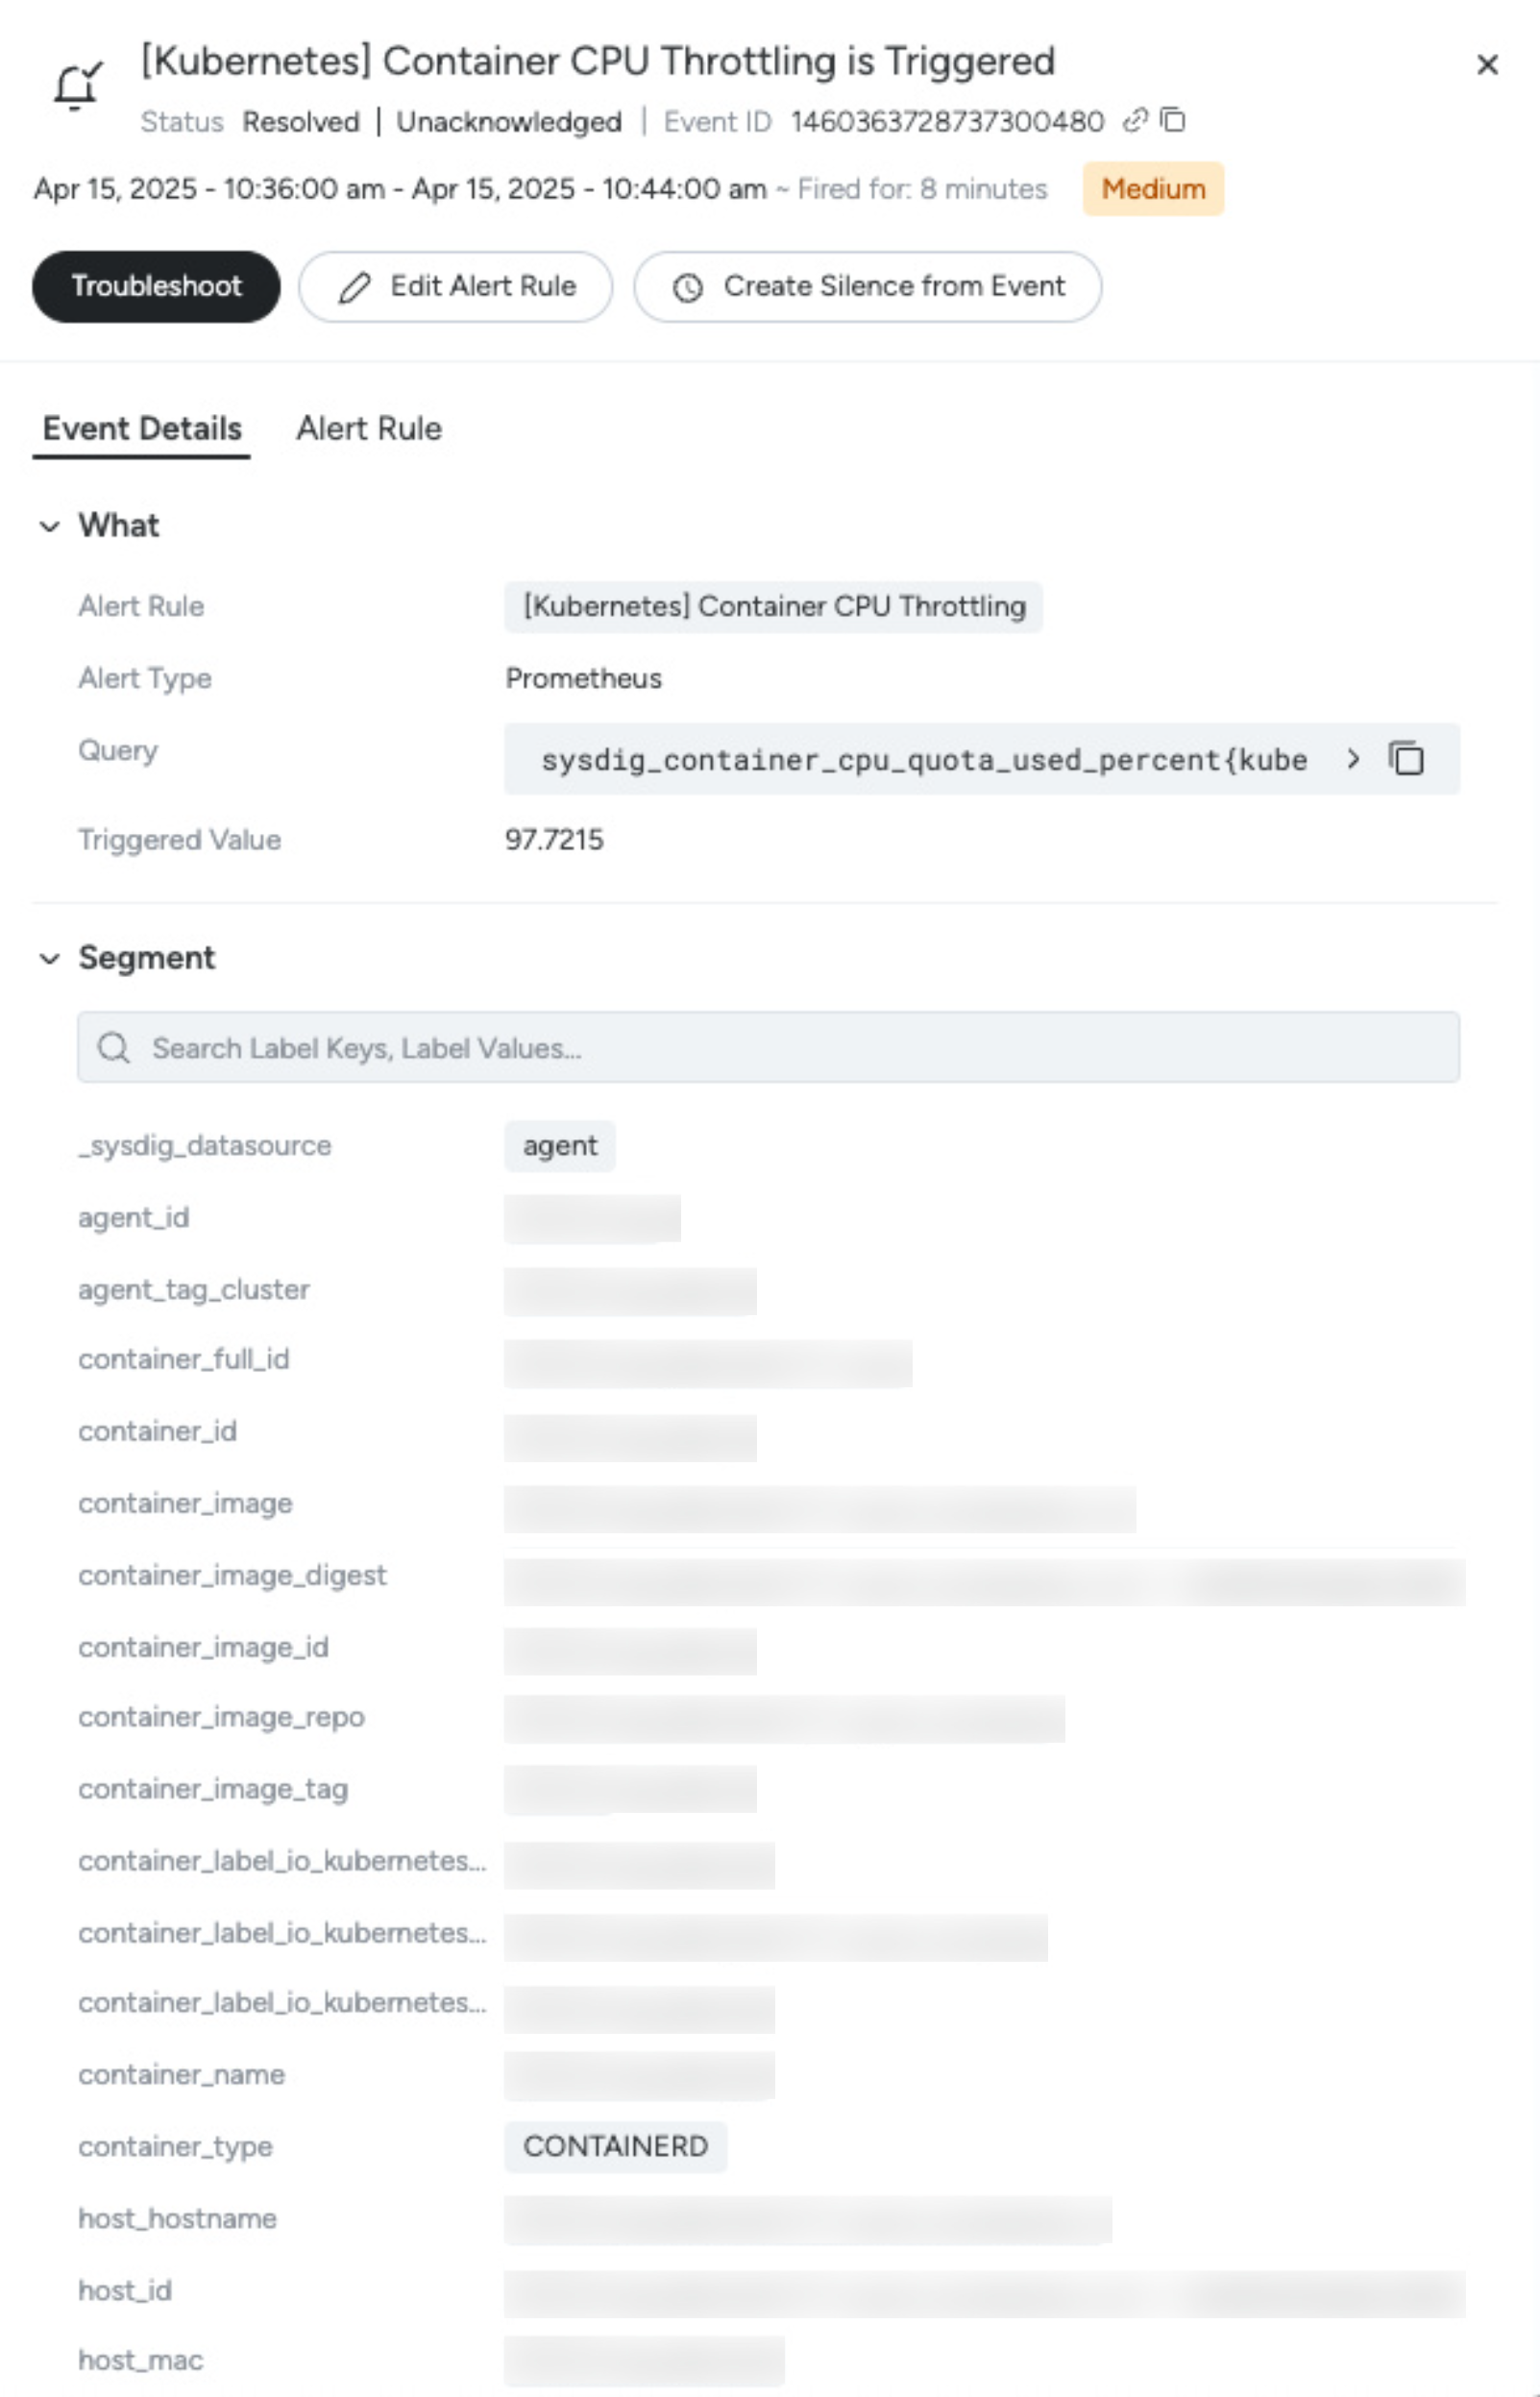
Alert Events
The example given below is of an Alert Event:
| Metadata | Description |
|---|---|
| Event ID | A 19-character unique identifier for the event in the event feed. Note: This is different from the 6-character alert occurrence ID used to identify a specific alert occurrence. |
| Severity | The severity of the event (High, Medium, Low, Info). |
| Status | The current state of the event (Triggered, Resolved) |
| Fired For | Duration the alert has been active. This starts when the alert condition is met and stops once the condition is no longer true. |
| Acknowledged | Indicates whether the event has been acknowledged by a user. |
| Alert Rule | The name of the alert rule that generated the event. |
| Alert Type | The type of alert. For example, Threshold, Prometheus, Event, Group Outlier |
| Query | The expression defined in the alert rule that was satisfied when the alert rule was triggered |
| Count Events that Match | (Alert on Events only) The specific search criteria that matched one or more events, triggering this alert. |
| Threshold (Optional) | The threshold that was satisfied, resulting in the alert being triggered |
| Triggered Value (Optional) | The value of the expression at the time the alert was triggered |
| Resolution Value (Optional) | The value of the expression that caused the alert to resolve |
| Segment | The unique entity that triggered the alert rule. |
| Scope | Additional context derived from labels enriched by the Sysdig agent. These labels provide more precise identification of the entity or environment where the event occurred. |
Click Troubleshoot to open the PromQL Query page. The page is automatically populated with the alert rule’s expression at the exact time when the alert occurrence was triggered. Review the query result to investigate what caused the alert.
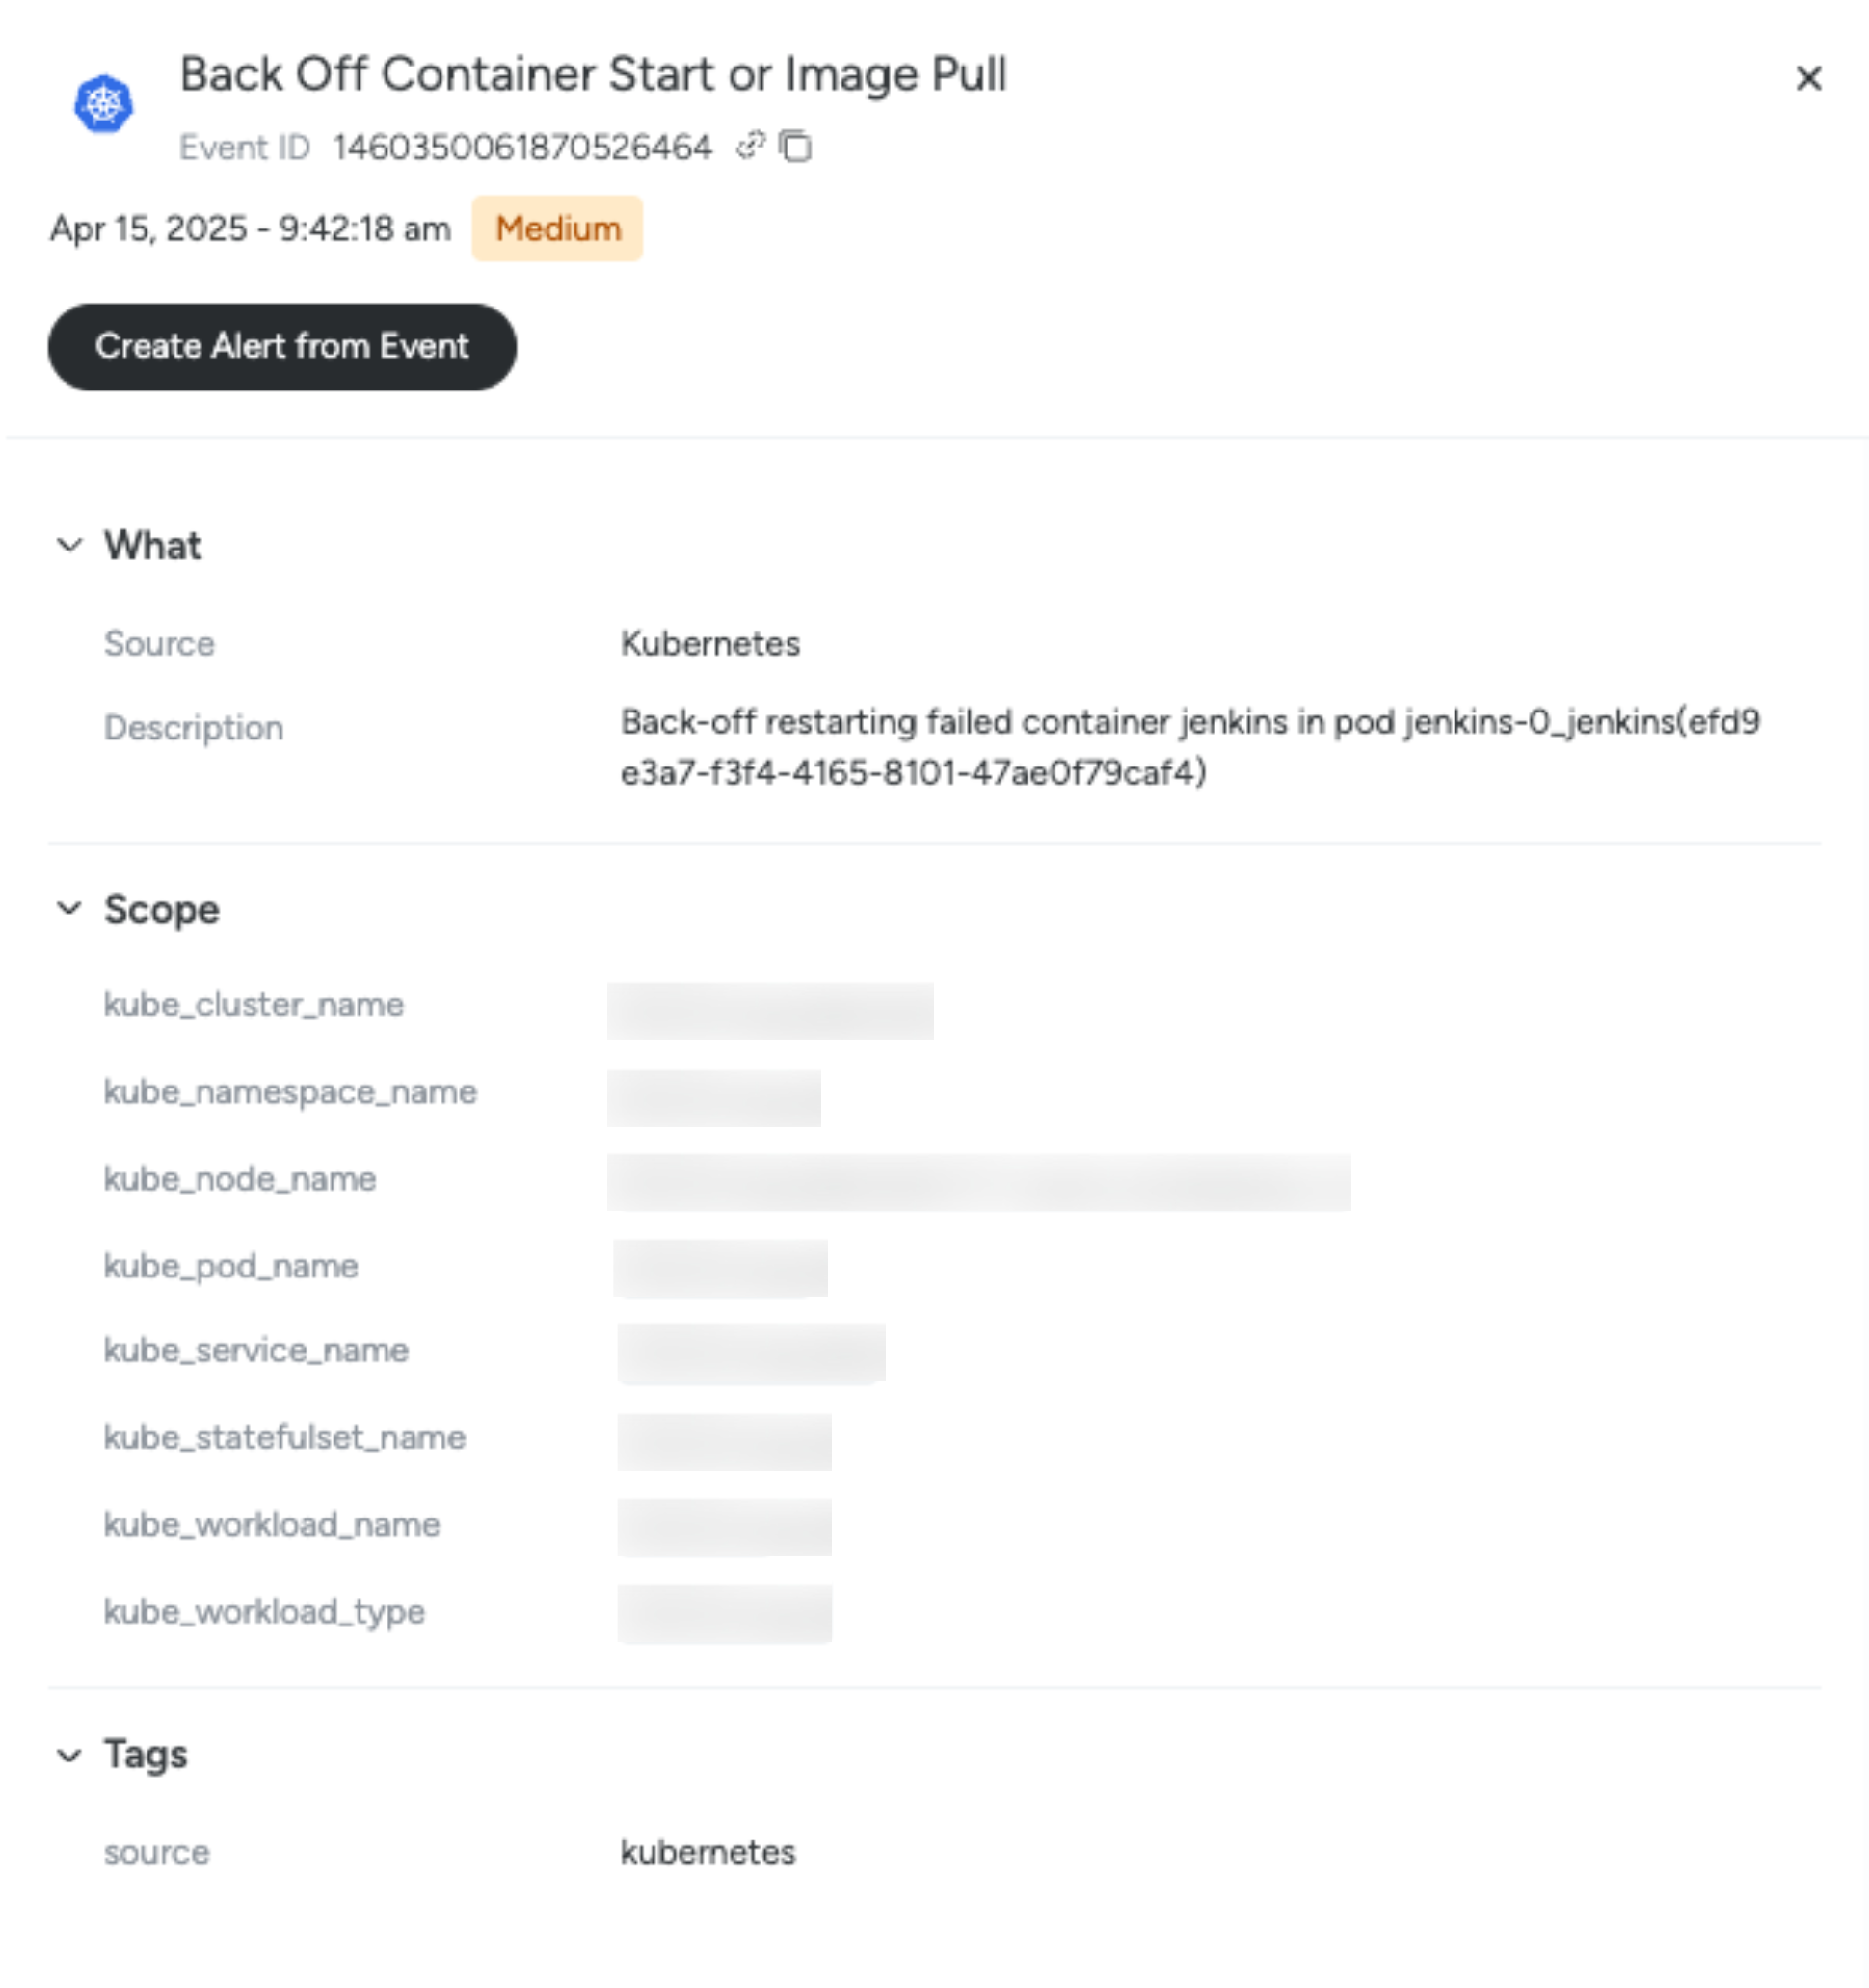
Infrastructure Events: Includes Kubernetes Events, Container Events, and Custom Events
Infrastructure Events are any events that occur within your infrastructure. These include:
- Kubernetes events
- Container events
- Custom events
These events follow the same structure and are displayed using a consistent format in the Event Details panel.
| Metadata | Description |
|---|---|
| Event ID | The unique ID of the event. |
| Severity | The severity of the event (High, Medium, Low, Info). |
| Date / Time | The date and time the event occurred. |
| Source | The source of the event (in this case, Kubernetes). |
| Description | The description of the event. |
| Scope | The scope of the event, identified as labelset |
| Tags | Any tags associated with the event |