Linux Host
In the Linux Host page of Advisor, different tabs appear depending on the current level in the Scope Tree: Non-clustered hosts, or in a specific Linux Host.
| Non-clustered hosts | Host | |
|---|---|---|
| Overview | ✅ | ✅ |
| Advisories | ✅ | ✅ |
| Alerts | ✅ | ✅ |
| Events | ✅ | ✅ |
| Disk | ❌ | ✅ |
| Network | ❌ | ✅ |
| Processes | ❌ | ✅ |
Each tab provides a wealth of information relevant to different parts of your infrastructure:
All Non-Clustered Hosts
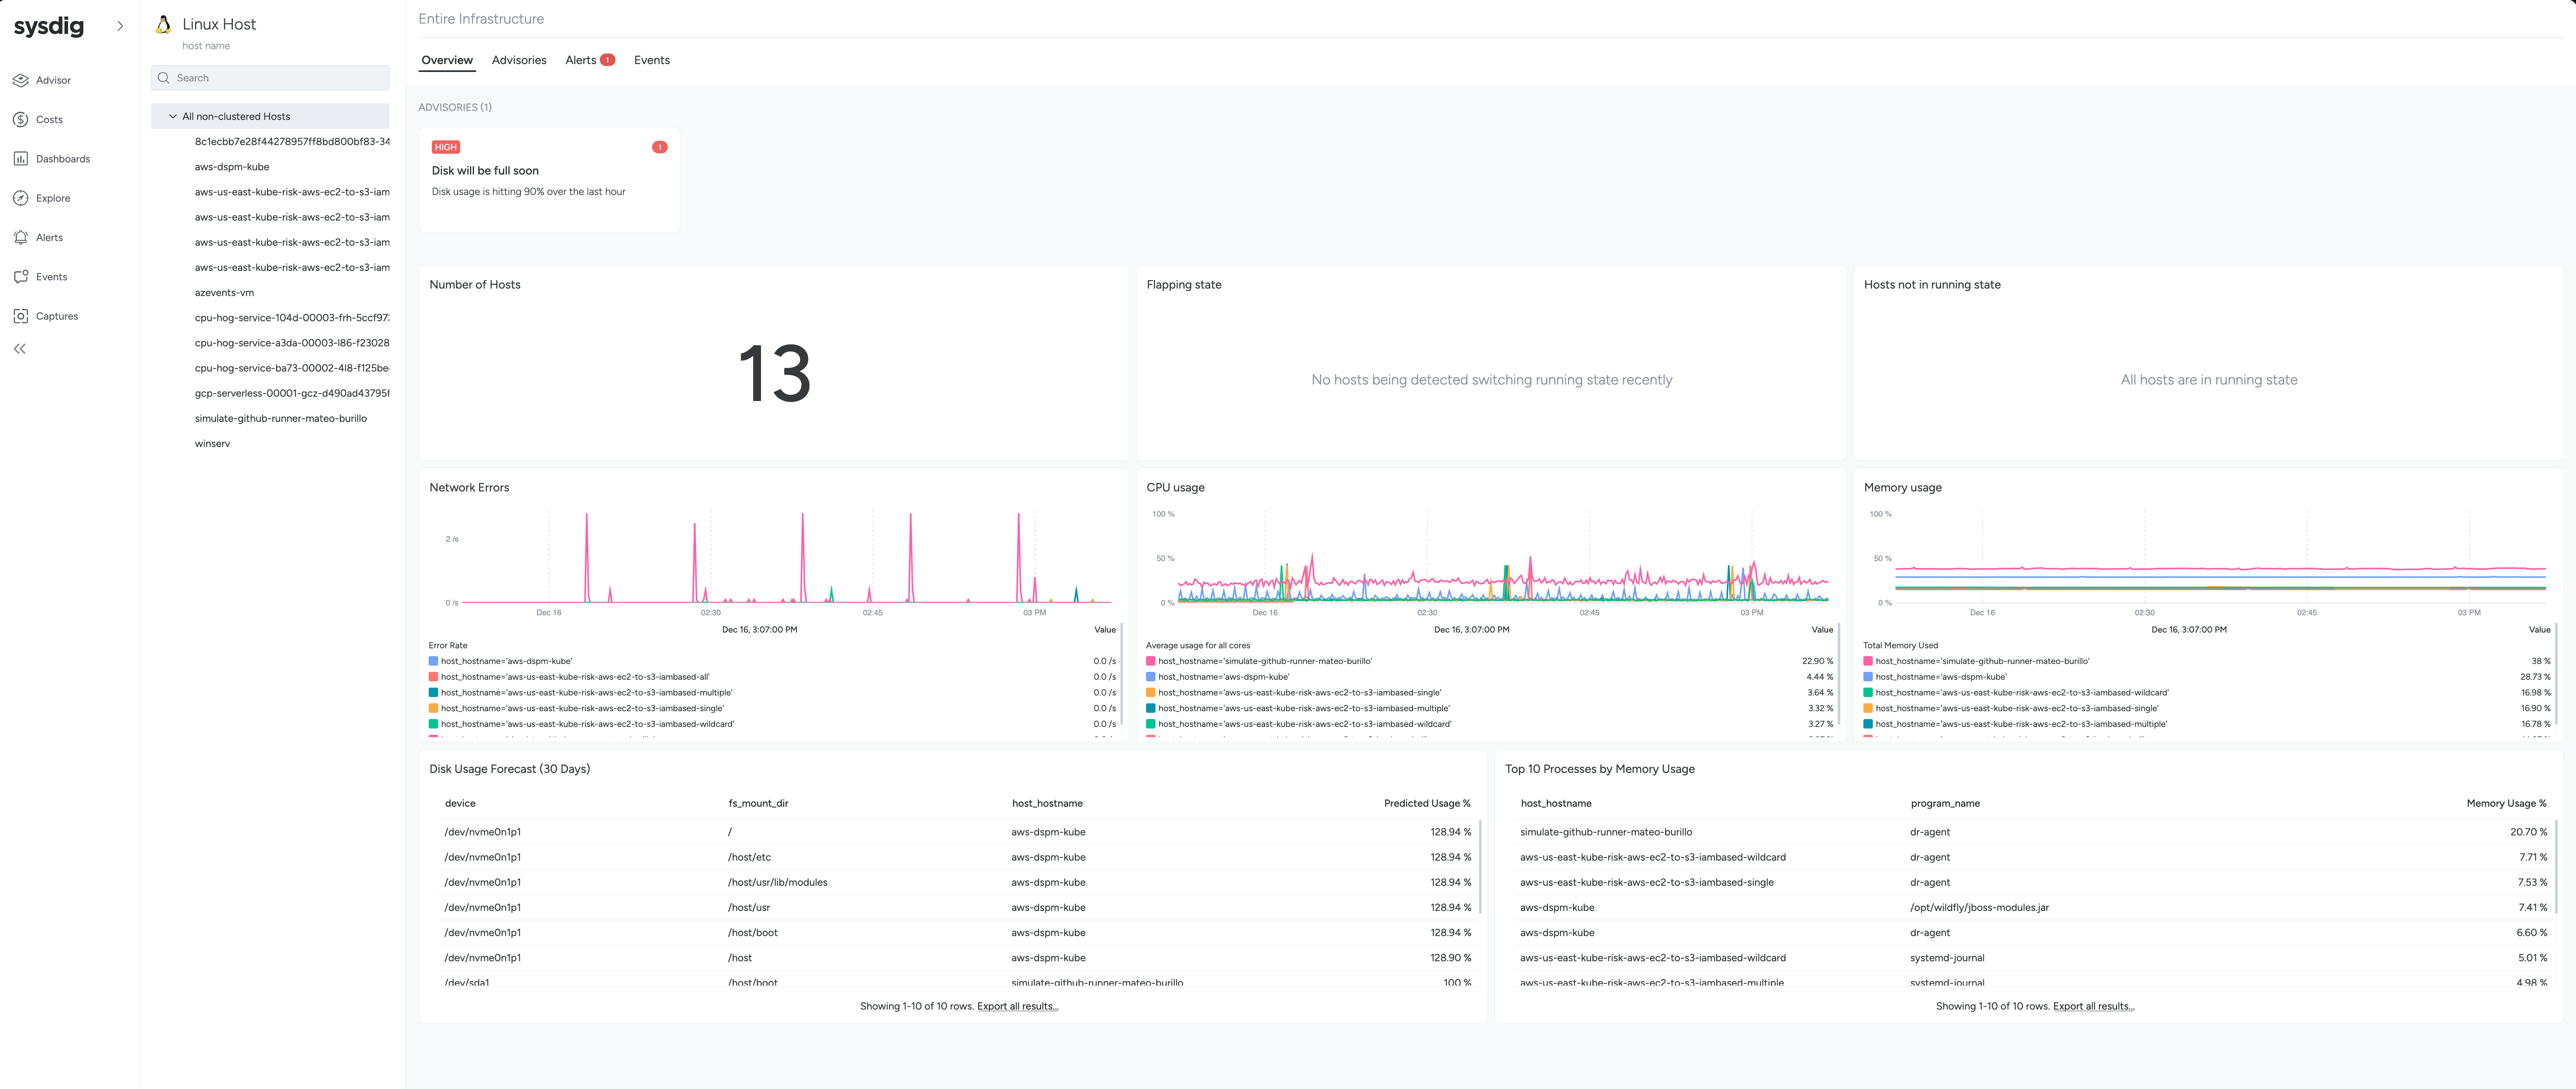
- Overview: A high level summary of your Linux Hosts status. Number of hosts, resource usage in a per-host basis, and a summary of all the advisories happening in the Linux Hosts.
- Advisories: See the key problems in your Linux Hosts and how to resolve them. For more detail, see Advisories.
- Alerts: Triggered alerts.
- Events: Events from your Linux Host.
One Specific Linux Host
- Overview: A high level summary of your Linux Hosts status. Number of hosts, resource usage in a per-host basis, and a summary of all the advisories happening in the Linux Hosts.
- Advisories: See the key problems in your Linux Hosts and how to resolve them. For more detail, see Advisories.
- Alerts: Triggered alerts.
- Events: Events from your Linux Host.
- Processes: A list of running processes, group by different categories: CPU, Memory, IO.
- Disk: Disk usage and throughput, running processes per file stat, and a disk usage forecast for the next 30 days.
- Network: Network activity in the host and connection information.
Advisories
Advisories evaluate the thousands of data points being sent by the Sysdig agent, and display a prioritized view of key problems in your infrastructure that affect the health and availability of your Linux Hosts.
When you select an advisory, relevant information related to the issue is surfaced, such as metrics and events. This enables you to pinpoint and resolve problems faster.
Example Issues Detected
Problem | Description |
|---|---|
High CPU usage | CPU usage is hitting over 80% for the last hour. |
Memory Pressure | Memory usage is hitting over 80% for the last hour. |
Disk will be full soon | Disk usage is hitting 90% over the last hour. |
Network Errors | High number of network errors detected on the host. |
Advisories are automatically resolved when the problem is no longer detected.