Configure Prometheus Remote Write
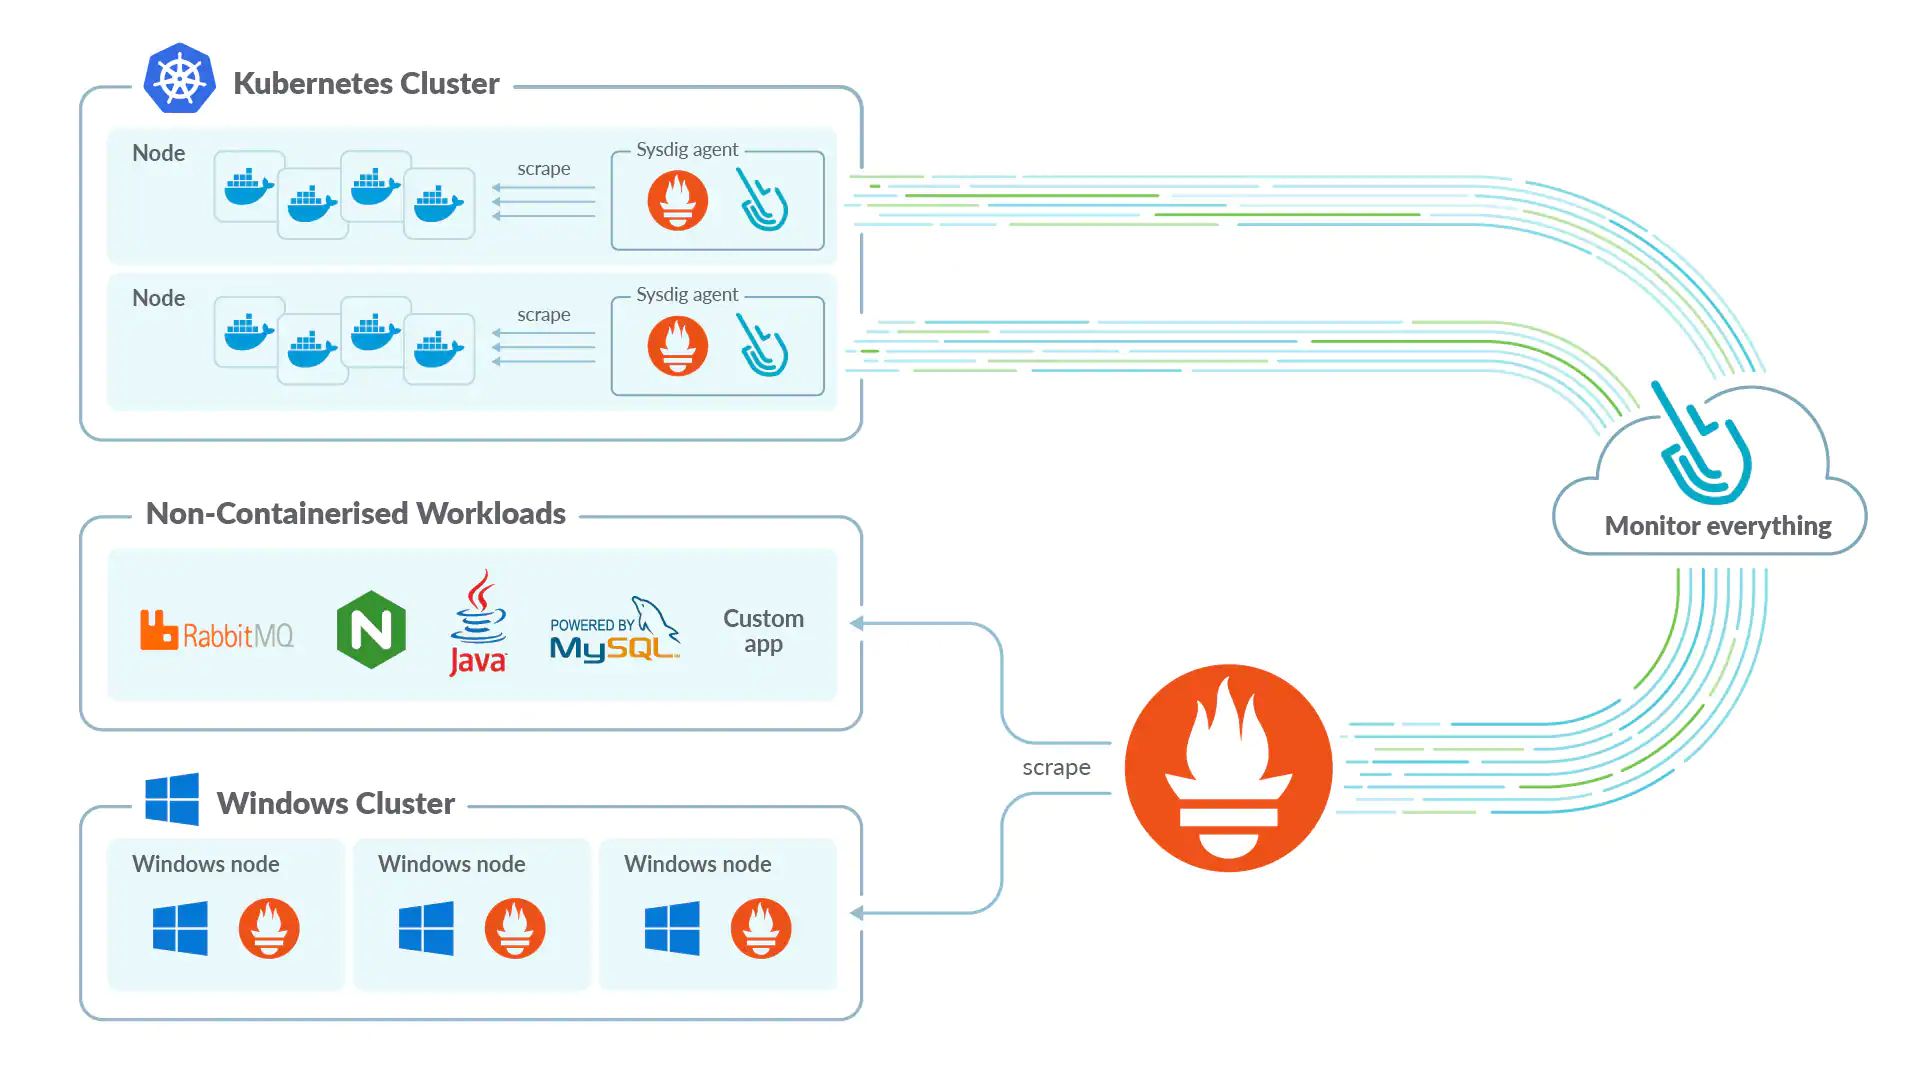
Use Prometheus Remote Write to access metrics from:
An existing Prometheus server
Additional environments, such as:
Windows
Managed Cloud Environments, such as AWS and IBM
Fargate
Internet of things (IoT)
Use the Sysdig agent in environments where an agent can be installed. However, use the Prometheus Remote Write to collect metrics from ephemeral or batch jobs that may not exist long enough to be scraped by the agent.
With Prometheus Remote Write, you can either analyze metrics through the Sysdig Monitor UI, or you can use PromQL, the standard Prometheus query language, to query the data.
Prerequisites
- Ensure you have a Prometheus server set up and collecting metrics.
- Collect your Sysdig API key.
- Confirm your endpoints and region.
Endpoints and Regions
Prometheus Remote Write resides in the ingest endpoints for each region under /prometheus/remote/write. The public Prometheus Remote Write endpoints for each region are listed in SaaS Regions and IP Ranges.
Configure Remote Write in a Prometheus Server
You need to configure remote_write in your Prometheus server to send metrics to Sysdig via Prometheus Remote Write.
The configuration of your Prometheus server depends on your installation. In general, you configure the remote_write section in the prometheus.yml configuration file:
global:
  external_labels:
    [ <labelname>: <labelvalue> ... ]
remote_write:
    - url: "https://<region-url>/prometheus/remote/write"
      bearer_token: "<your API Token>"
The communication between your Prometheus server and Prometheus Remote Write should use the authorization header with the Sysdig API key (not the agent access key) as the bearer token.
Alternatively, you can also use the bearer_token_file entry to refer to a file instead of directly including the API token.
Prometheus does not reveal the bearer_token value in the UI.
Customize Metrics
To enable customization, Sysdig provides additional options to control which metrics you want to send to Prometheus Remote Write.
Manage Metrics
Prometheus Remote Write by default sends all the metrics to Sysdig Prometheus Remote Write. These metrics are sent with a remote_write: true label appended to it so you can easily identify them.
Label Metrics
You can specify custom label-value pairs and send them with each time series to the Prometheus Remote Write. Use the external_labels block in the global section in the Prometheus configuration file. This is similar to setting an agent tag and allowing you to filter or scope the metrics in Sysdig Monitor.
For example, if you have two Prometheus servers configured to remote write to Prometheus Remote Write, you can include an external label to identify them easily:
Prometheus 1

global:
  external_labels:
    provider: prometheus1
remote_write:
- url: ...

Prometheus 2

global:
  external_labels:
    provider: prometheus2
remote_write:
- url: ...
Filter Metrics
With the default configuration, all the metrics are remotely written to Prometheus Remote Write. You can control the metrics that you collect and send to Sysdig. To select which series and labels to collect, drop, or replace, and reduce the number of active series that are sent to Sysdig, set up relabel configurations by using the write_relabel_configs block within your remote_write section.
For example, you can send metrics from one specific namespace called myapp-ns as follows:
remote_write:
- url: https://<region-url>/prometheus/remote/write
  bearer_token_file: /etc/secrets/sysdig-api-token
  write_relabel_configs:
  - source_labels: [__meta_kubernetes_namespace]
    regex: 'myapp-ns'
    action: keep
Verify Installation
To verify that the Prometheus Remote Write has been installed correctly:
Log in to Sysdig Monitor.
Do one of the following:
Open Explore > PromQL Query and runt the following query:
sum(sysdig_ts_usage{metric_category="PROMETHEUS_REMOTE_WRITE"})You will see the time series usage graph on the screen.
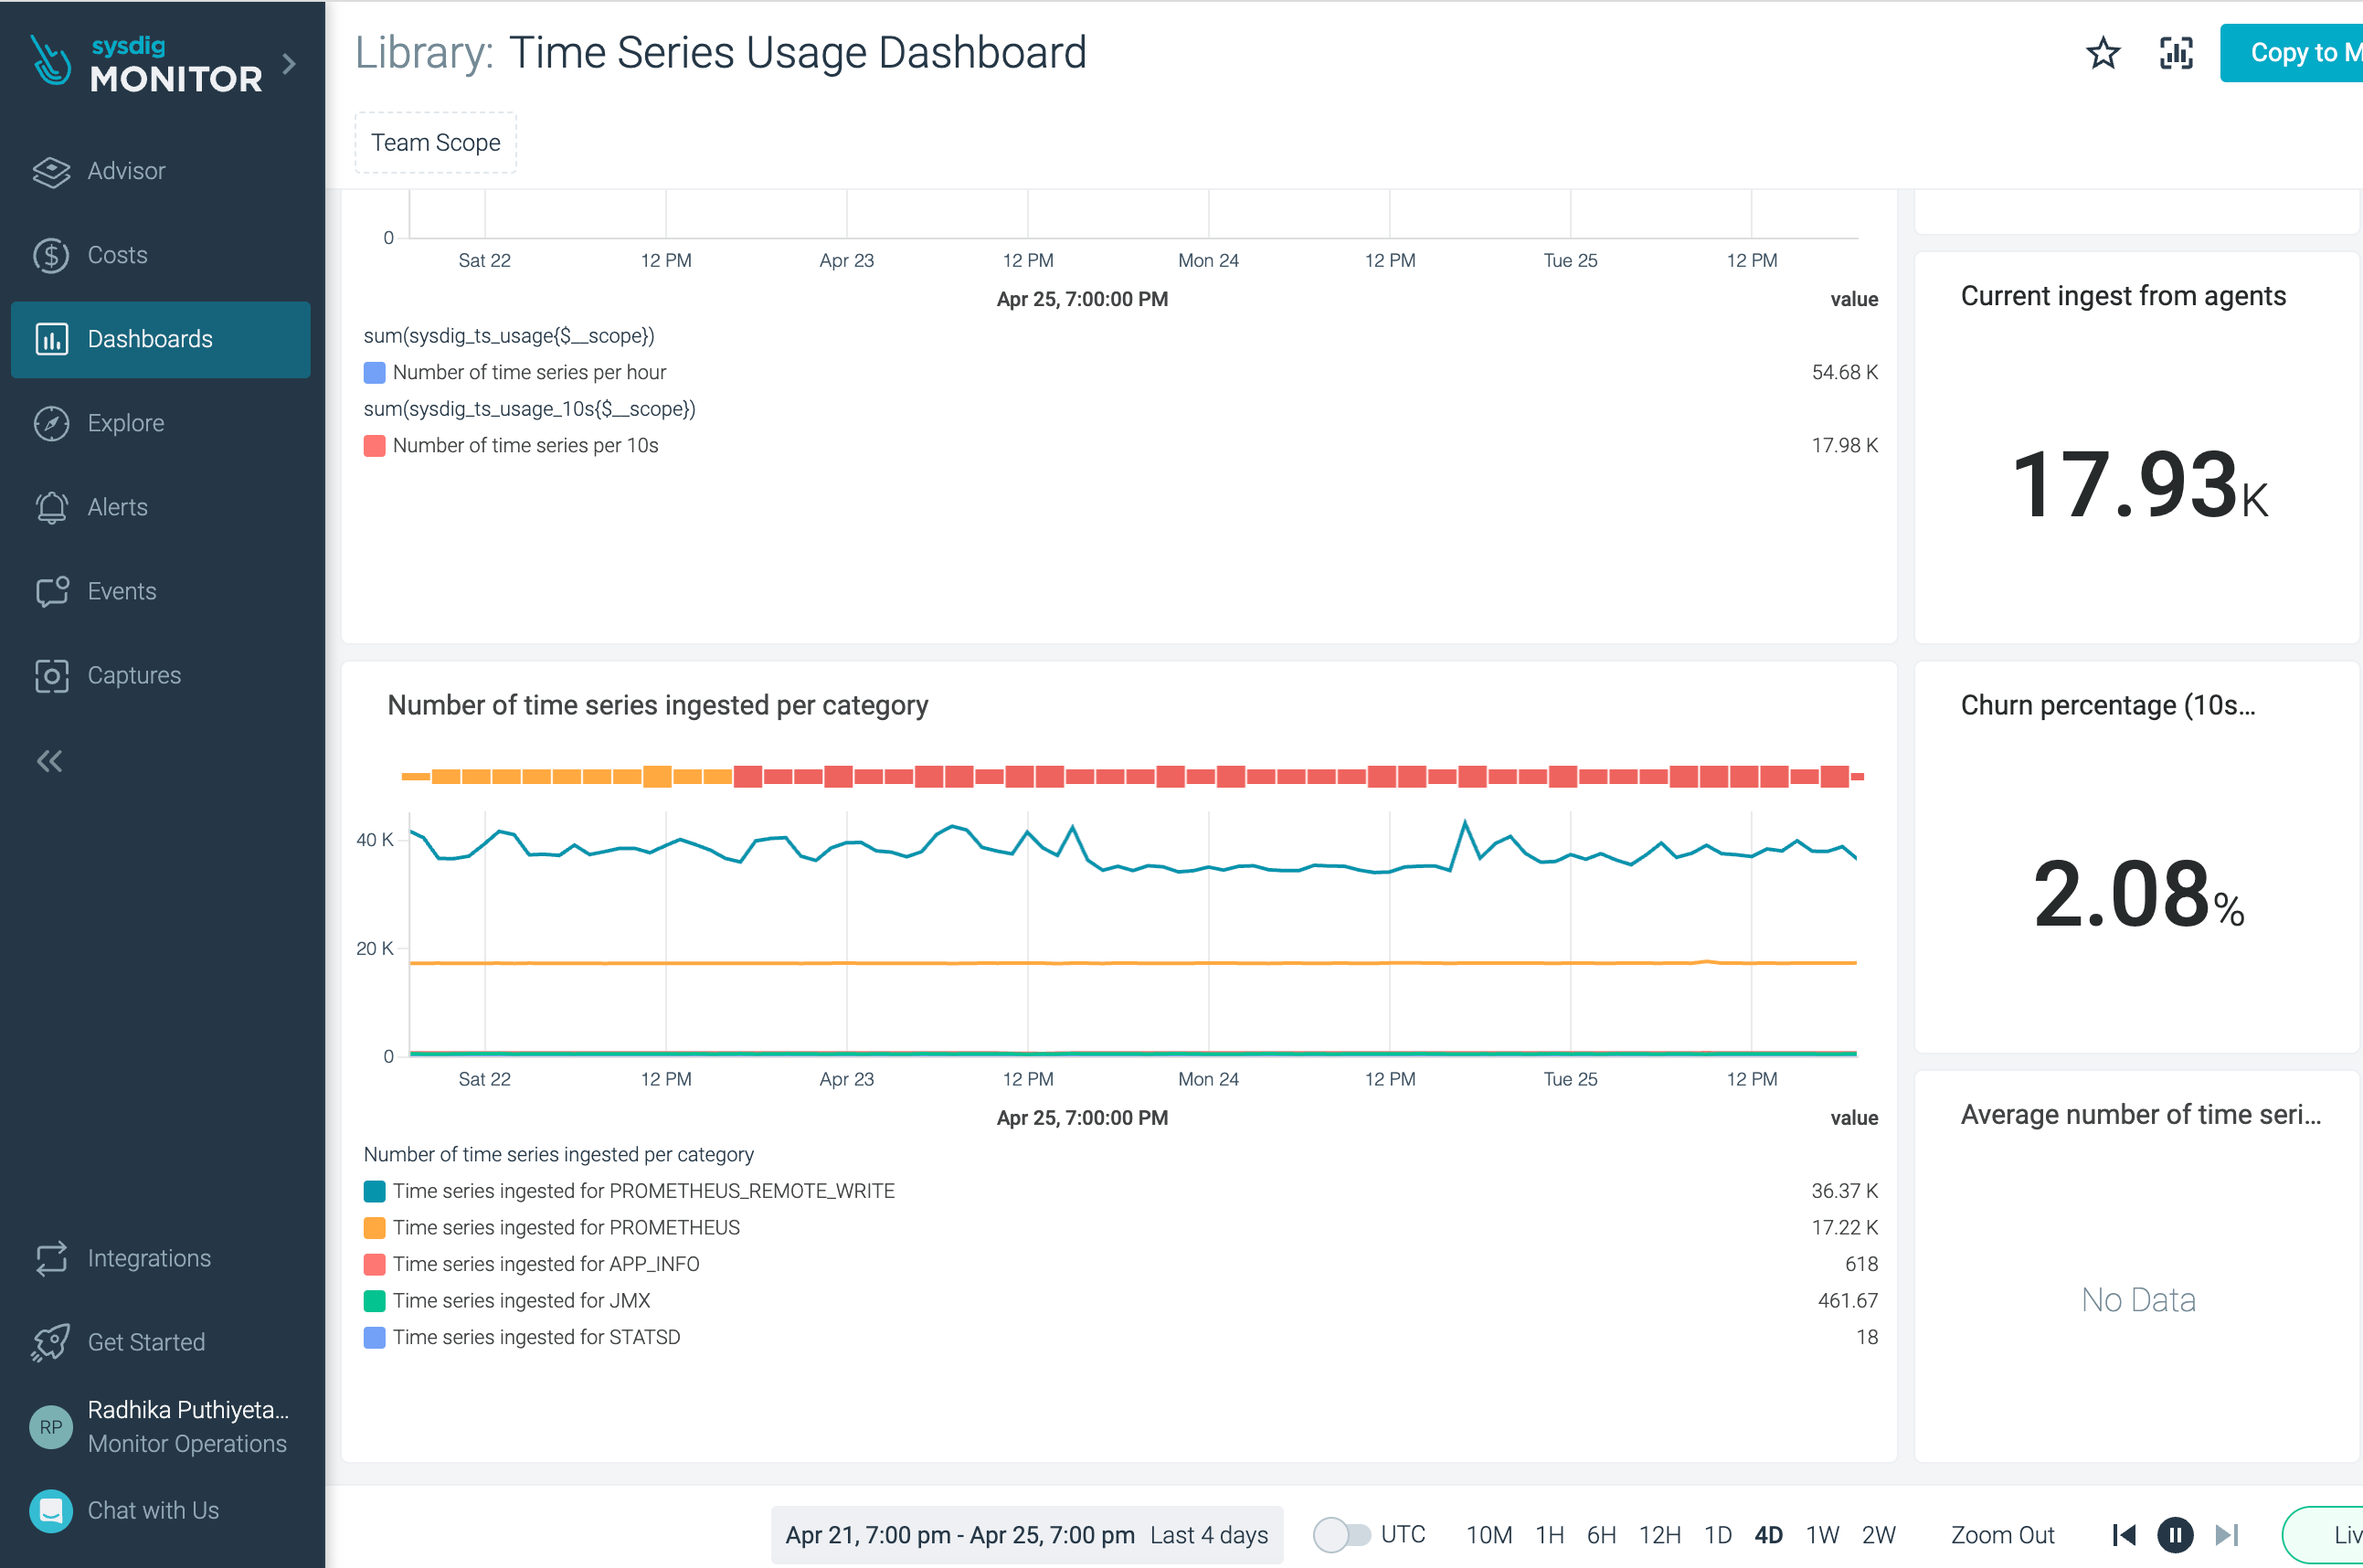
Open Dashboards > Sysdig Monitor > Time Series Usage.
Under the Number of time series ingested per category panel, check the time series category.
You will see PROMETHEUS_REMOTE_WRITE as one of the categories.
Rate Limit
The default limits for each user can be raised as required. The defaults are good for most users, and the limits help protect against any misconfigurations.
Feature | Limit |
|---|---|
Parallel writes | 100 concurrent requests. This doesn't necessarily mean 100 Prometheus servers because the time at which the data is written is distributed. |
Data points per minute | One million. The number of data points sent depends on how often metrics are submitted to Sysdig. A scrape interval of 10s will submit more DPM than an interval of 60s. |
Number of writes per minute | 10,000 |
Team Scoping
It is possible to scope a Sysdig Team to only access metrics matching certain labels sent via Prometheus Remote Write. See Manage Teams and Roles
Limitations
Alerts based on metrics ingested through Prometheus Remote Write will be delayed by approximately 5 minutes to ensure all the data has been correctly ingested.
Metrics sent to Prometheus Remote Write can be accessed in Explore, but they are not compatible with the scope tree.
Label enrichment is unavailable. Only labels collected at the source can be used. Add additional labels to perform further scoping or pivoting in Sysdig.
Remote write functionality does not support sending metric metadata.
Suffix the metric name with
_total,_sum, or_countto store them as a counter. Otherwise, the metrics will be handled as a gauge.Units can be set in Dashboards manually.


