Filter Custom Metrics
To exclude metrics, Sysdig recommends that you edit the prometheus.yaml file. If you use the metric_filter to exclude metrics, you must restart the agent before your changes take effect.
To filter custom metrics, you can:
Use the configurable patterns.
Use
logand identify the custom metrics that are exceeding limits.
After you identify the key custom metrics that must be received, use the new include and exclude filtering parameters to make sure you receive them before the metrics limit is hit.
Include and Exclude Metrics
Here is an example configuration entry in the agent configuration file:
metrics_filter:
  - include: test.*
  - exclude: test.*
  - include: haproxy.backend.*
  - exclude: haproxy.*
  - exclude: redis.*
  - exclude: '*'
For the above configuration entry, the action for these metrics is:
test.\* : send
haproxy.backend.request: send
haproxy.frontend.bytes : drop
redis.keys : drop
If no metric matches any of the above include filters, it will be dropped with the last - exclude: '*'
When the agent reads the metrics, they are filtered according to the configured filters and the filtering rule order. The first rule that matches is applied. Therefore, in this example, the inclusion item for test.\* will be applied, and the second exclude rule for the same exact metric entry will be ignored.
The combined limit for include and exclude filters is 100 entries.
Log Accepted and Dropped Metrics
Logging is disabled by default. To enable logging and see which metrics are accepted or dropped, add the following configuration entry into the dragent.yaml file:
metrics_excess_log: true
Once enabled, logging occurs at INFO level every 30 seconds and lasts for 10 seconds. Logs are stored in /opt/draios/logs/draios.log and are formatted like this:
+/-[type] [metric included/excluded]: metric.name (filter: +/-[metric.filter])
+ indicates included and - indicates excluded.
The first + or -, followed by type provides an easy way to quickly scan the list of metrics and spot which are included or excluded .
The second entry specifies the metric type: statsd, app\_check, service\_check, or jmx.
A third entry spells out whether included or excluded, followed by the metric name. Finally, the last entry, in parentheses, gives information about the filter applied and its effect.
With this example filter rule set:
metrics_filter:
  - include: mongo.statsd.net*
  - exclude: mongo.statsd.*
You might see the following INFO level log entries (timestamps stripped):
-[statsd] metric excluded: mongo.statsd.vsize (filter: -[mongo.statsd.*])
+[statsd] metric included: mongo.statsd.netIn (filter: +[mongo.statsd.net*])
Reduce Metrics Consumption
The Sysdig Agent collects metrics in your cloud environments and processes time series. Ingesting a large number of time series can exceed your Time Series Billing. This section explains how you can exclude and limit time series ingestion.
Excluding Default Metrics and Prometheus Remote Write Metrics - Limitations
After it is installed, the Sysdig Agent collects thousands of metrics, such as sysdig_container_cpu_used_percent at no additional cost. These are known as default metrics and their collection cannot be disabled. Metrics that are not collected by default are called custom metrics. The collection of custom metrics counts towards your Time Series Billing while default metrics do not.
To stop custom metrics from being forwarded to Sysdig via Prometheus Remote Write, configuration changes must be made directly in the prometheus.yaml file. You cannot drop a metric once it has already been ingested.
Excluding metrics from collection only applies to custom metrics that are collected by the Sysdig Agent.
Exclude Clusters from Collection
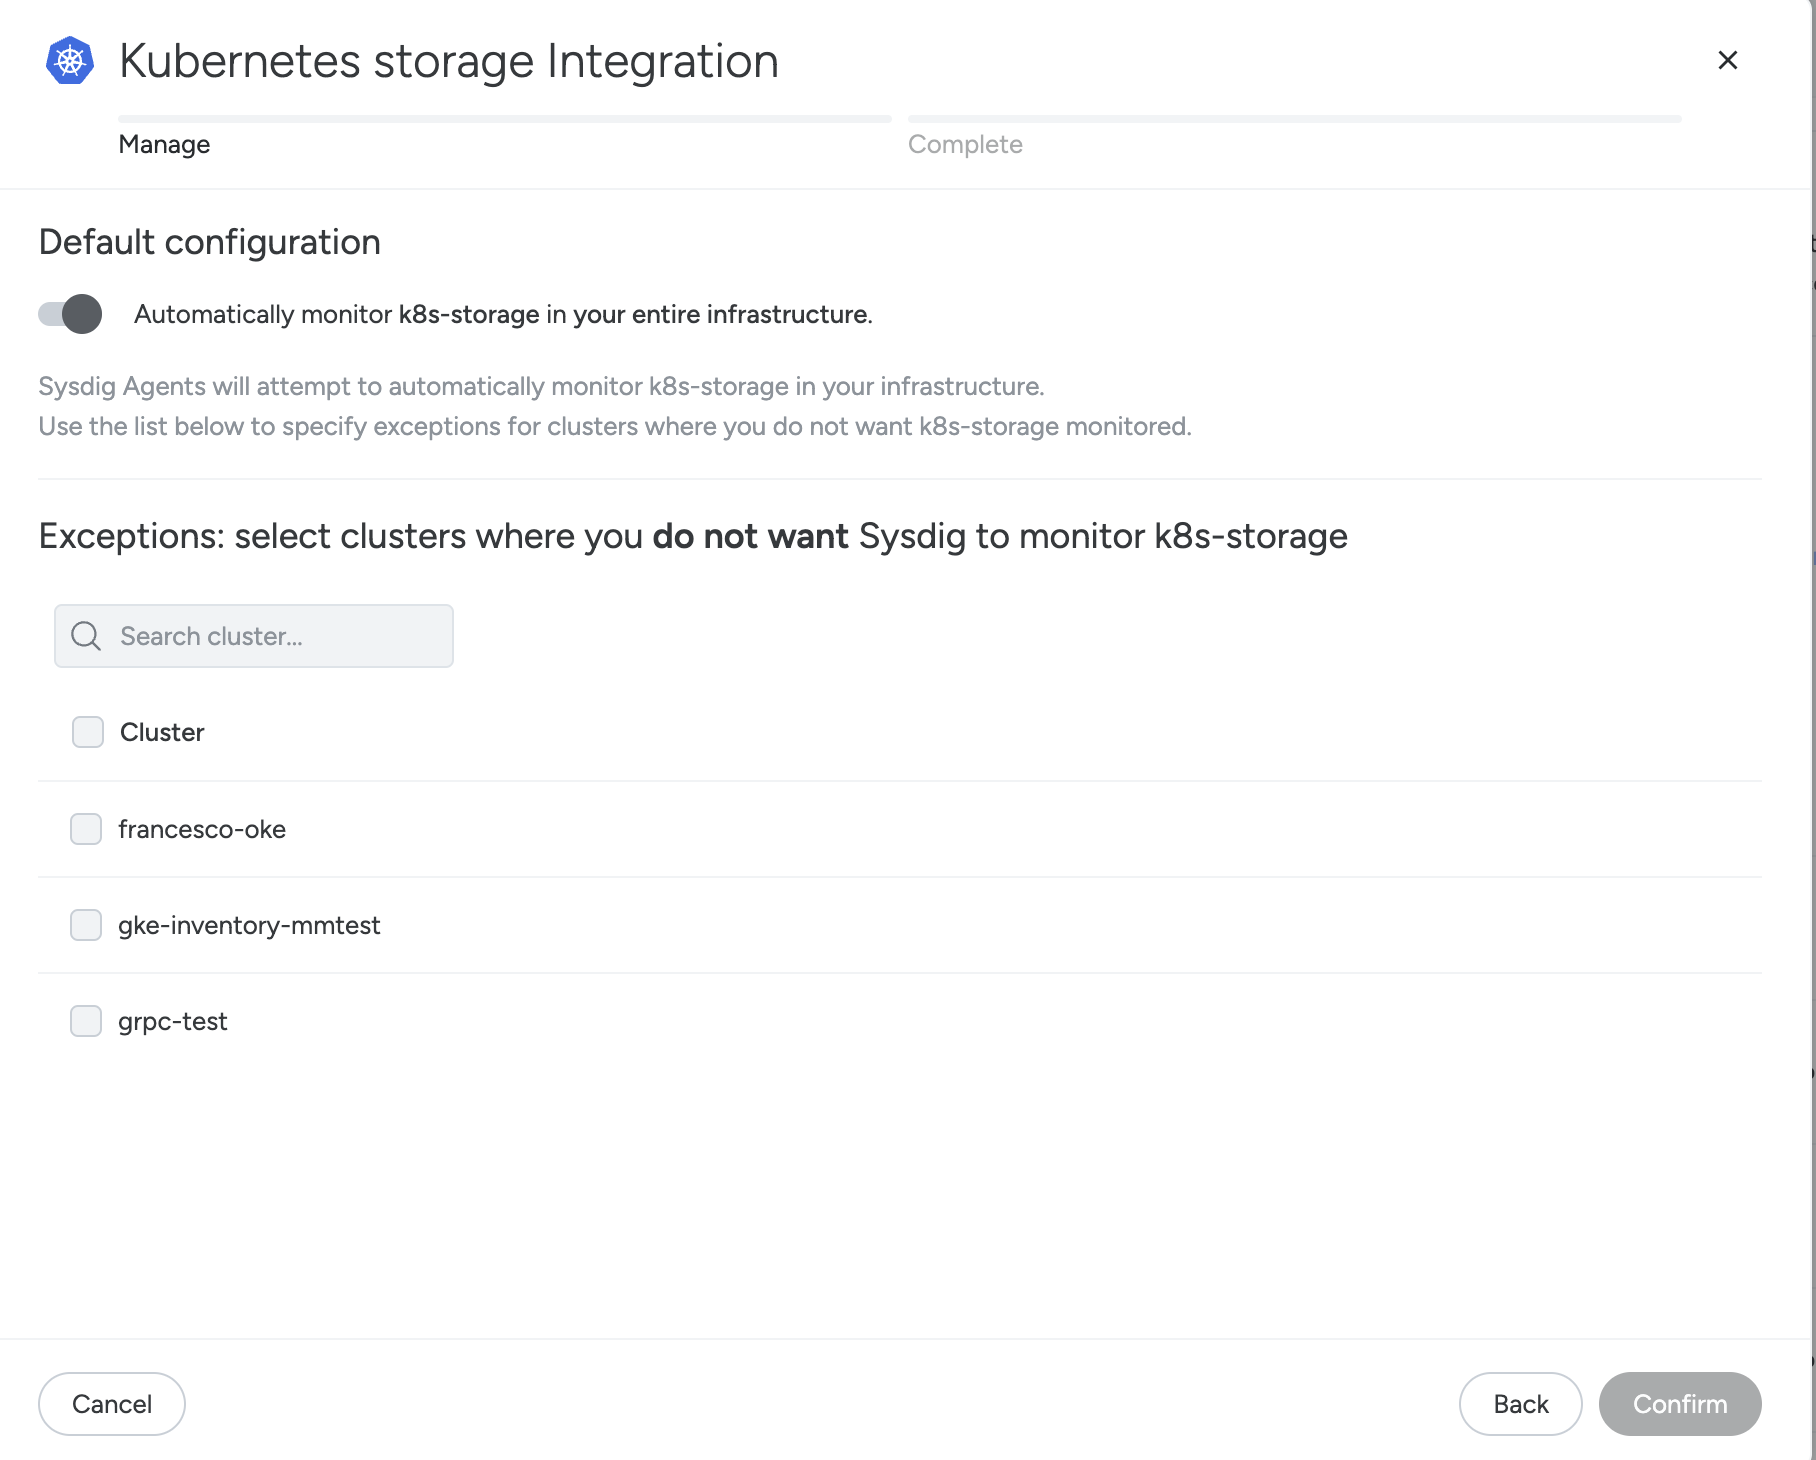
Admins can exclude specific Kubernetes clusters from metrics collection for all supported monitoring integrations, except for the Prometheus Default Job (k8s-pods). To disable a cluster integration:
Log in to Sysdig Monitor as an Admin, and navigate to Integrations > Monitoring Integrations from the left navigation bar.
On the Monitoring Integrations page, select an integration that is Reporting Metrics.
Click Manage this Integration.
Under Exceptions, select the clusters you wish to exclude.
Click Confirm, then Close the window.
This excludes all metrics associated with this integration for the specified cluster from being collected by the agent. The change may require a few minutes to take effect.
Exclude Workloads from Collection
The Sysdig agent collects metrics from any workload labelled with the prometheus.io/scrape='true' annotation. To prevent these metrics from being collected, either remove the annotation prometheus.io/scrape='true' or apply the following annotation:
spec:
  template:
    metadata:
      annotations:
        promcat.sysdig.com/omit: 'true'
You can apply this annotation across an entire namespace with the following kubectl command:
kubectl get pods -n <namespace> -o name | xargs -I {} kubectl annotate {} promcat.sysdig.com/omit='true'
Exclude Metrics Collection Jobs with the Sysdig API
You can use the Sysdig API to exclude specific metrics without turning off the integration or omitting all metrics at the workload level. This is useful for the Prometheus Default Job, where disabling the entire k8s-pods job may have unintended consequences for workloads that rely on the collection of metrics via kubernetes annotation.
Disable Collection of a Single Metric for a Specified Prometheus Job
Some metrics with high cardinality may not offer substantial value. Disable the collection of such metrics to reduce time series consumption.
In the following example, http_roundtrip_duration_seconds_bucket is a metric that is collected by the Prometheus Default k8s-pods job. To exclude the http_roundtrip_duration_seconds_bucket metric from being collected, use the following bash command:
curl --location --request POST 'https://<regional-endpoint>/monitor/prometheus-jobs/v1/disabled-metrics' \
--header 'Authorization: Bearer <token>' \
--header 'content-type: application/json' \
--header 'X-sysdig-public-notation: true' \
--data-raw '{
   "data": [
      {
         "jobName": "k8s-pods",
         "metrics": [
            {
               "metricName": "http_roundtrip_duration_seconds_bucket",
               "isDisabled": true
            }
         ]
      }
   ]
}'
Re-enable Metrics Collection for a Specified Prometheus Job
To re-enable a metric whose collection was previously disabled, you can use the same endpoint:
curl --location --request POST 'https://<regional-endpoint>/monitor/prometheus-jobs/v1/disabled-metrics' \
--header 'Authorization: Bearer <token>' \
--header 'content-type: application/json' \
--header 'X-sysdig-public-notation: true' \
--data-raw '{
   "data": [
      {
         "jobName": "k8s-pods",
         "metrics": [
            {
               "metricName": "http_roundtrip_duration_seconds_bucket",
               "isDisabled": false
            }
         ]
      }
   ]
}'
List All Disabled Metrics for a Specific Prometheus Job
To list all disabled metrics for a specific Prometheus job, use the following bash command:
curl --location --request GET 'https://<regional-endpoint>/monitor/prometheus-jobs/v1/disabled-metrics' \
--header "Authorization: Bearer <token>"
For details regarding API usage, see Access Next Gen API docs.
