Dashboards
Overview
With Sysdig Monitor Dashboards you can:
- Create queries using a guided mode, called Form-Mode.
- Create queries using PromQL.
- Configure the event overlay which lets you enhance dashboards with event information.
- Leverage different visualization types.
Create a New Dashboard
You can create a dashboard from scratch, or start with a template from the Dashboard Library.
Create a Dashboard from the Library
In the Dashboard Library, you can use templates to serve as starting points for your own dashboard:
Log in to Sysdig Monitor.
Select Dashboards.
Select the Dashboard Library tab.
Select a template.
The Dashboard opens.
To customize the dashboard, select Copy to My Dashboards.
Enter a name for the new Dashboard.
Select Create and Open.
Create a Dashboard from Dashboard Manager
Every dashboard must have at least one panel. You can start to create a dashboard by creating a new panel:
Log in to Sysdig Monitor.
Select Dashboards.
The Dashboard Manager opens.
Select Create a New Dashboard from the top right corner.
The New Panel page appears.
Define the metric and visualization type.
Select Save.
The dashboard is created with the panel you defined. You can add edit the dashboard’s name, or select Add Panel to add more panels.
Create a Dashboard from Explore
You can create a dashboard from the Explore module to transfer your findings from a metric query into a dashboard:
Log in to Sysdig Monitor.
Select Explore > Metrics Explorer.
Define a metric query.
Select Actions > Create Dashboard Panel from the top right corner.
The Copy Panel to Dashboard modal appears.
Select an existing dashboard from the drop-down, or enter a new name to create a new dashboard.
(Optional) Check the box to Open the Dashboard after copying.
Select Copy.
Delete a Dashboard
The owner or the administrator of a shared dashboard can delete it.
When a user duplicates a dashboard, they become the owner of the copy and can delete it freely.
Dashboards can be deleted from different locations:
- Dashboard settings
- Dashboard Manager
Define Dashboard Scope
To configure the scope of a dashboard:
- Click the edit (pencil) icon beside the Dashboard’s current scope.
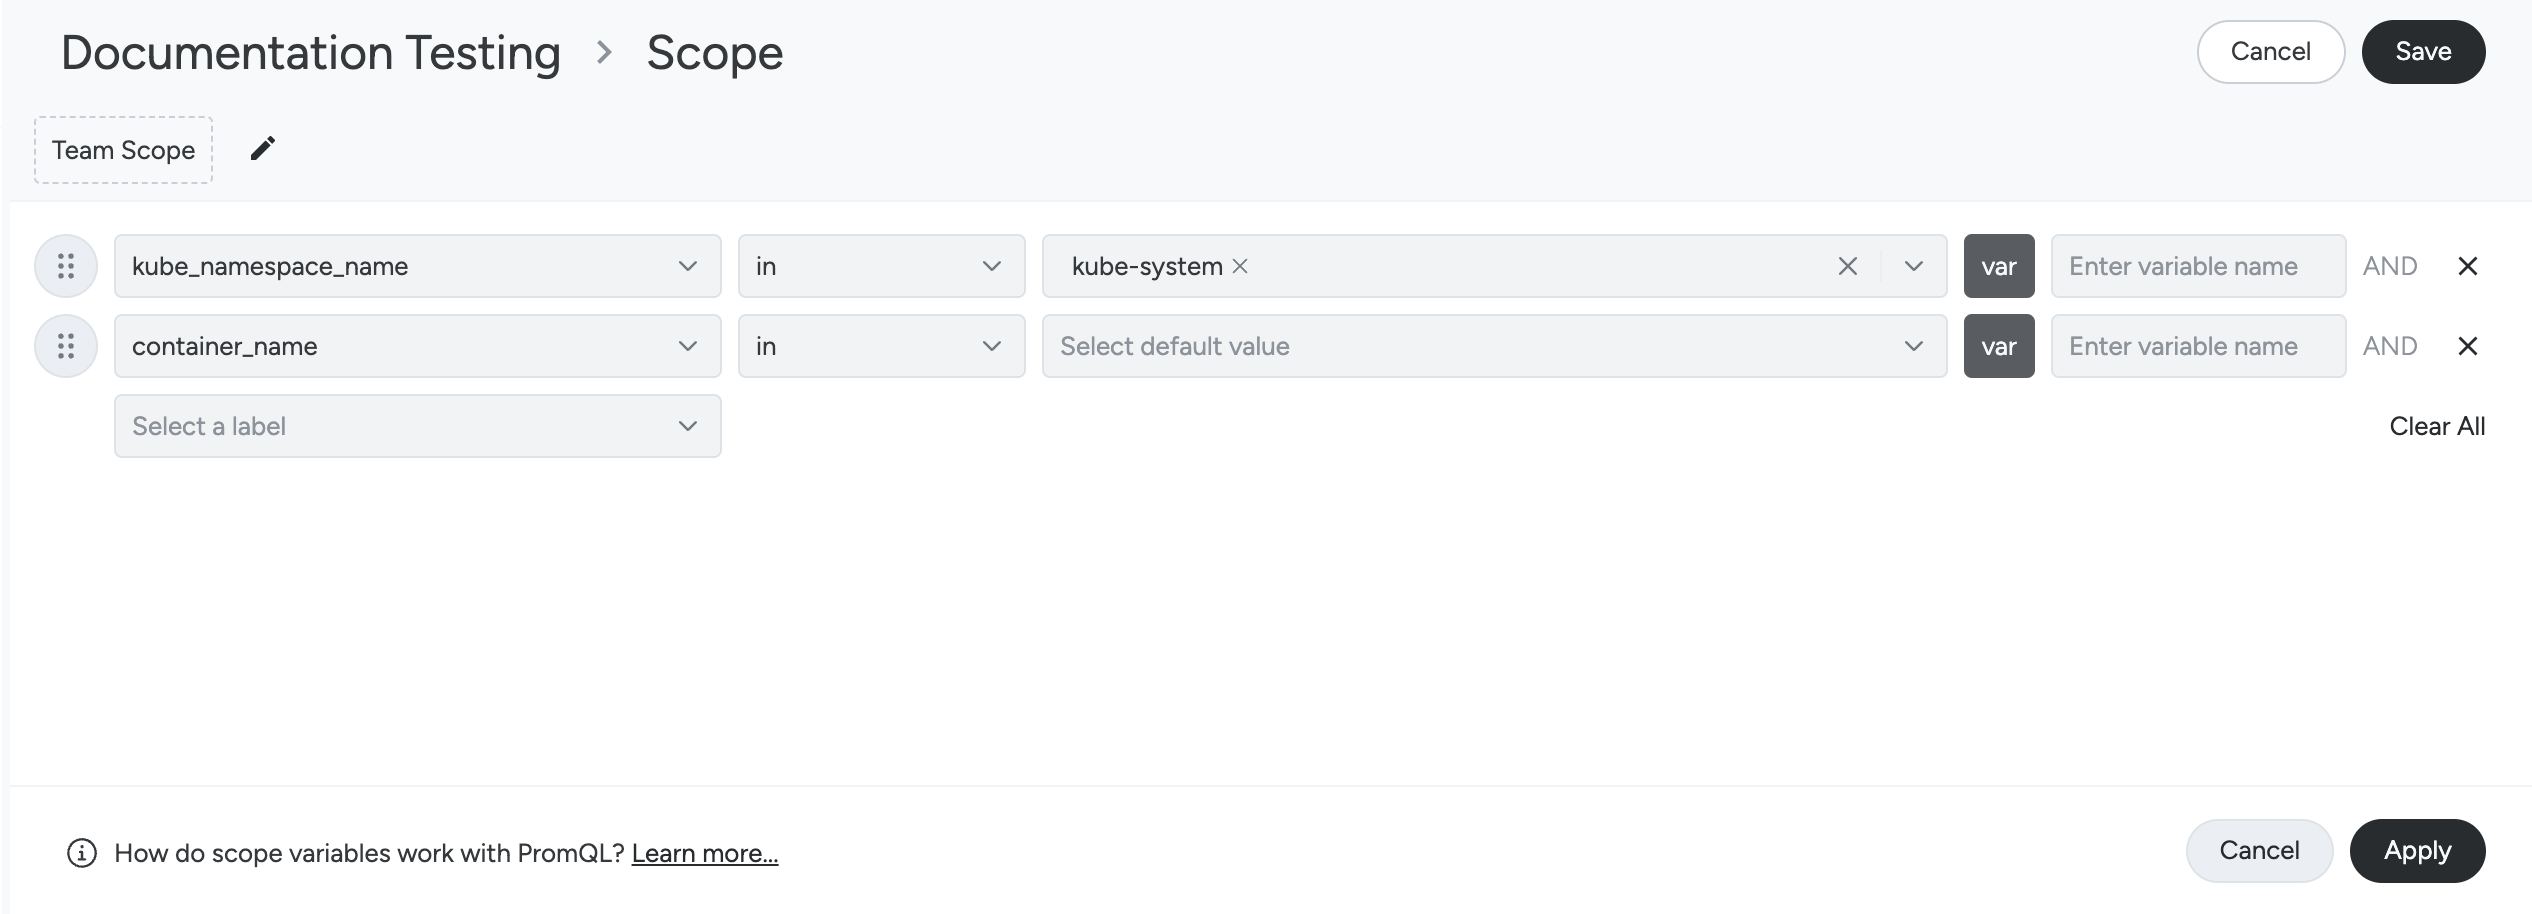
The scope dropdown appears.
The scope editor dynamically filters the available label key-value pairs based on previous filter selections, so that only valid options are shown. For example, if the value of the kube_namespace_name label is kube-system, the values of the subsequent label, container_name will be filtered by kube-system. This means the containers rendered for filtering are only those that are part of the kube-system namespace.
Edit Variables
In the dashboard scope editor, you can select a label key such as kube_cluster_name and assign it a value like prod-cluster-01. This selection creates a variable $kube_namespace_name that you can use across your dashboard. Any panel that includes this variable in its query will automatically be scoped to the selected cluster, making it easy to apply consistent filtering across the entire dashboard.
Set a Default Dashboard
You can configure a default dashboard by setting the default entry point for a team. For more information on configuring a default entry point, see Team Settings - Default Entry Point.
Share a Dashboard with Teams
You can share a dashboard with your current team, allowing other team members to view the dashboard, as well as edit the panels if they have edit permissions within the team.
You can only share dashboards with teams you have membership for. Otherwise, the list of teams under Shared with may be empty. One workaround is to transfer dashboard ownership to an Admin user who has membership across all teams, or by requesting membership to other teams.
If a dashboard has been shared with another team, a user within that team can then copy it to make it their own if they wish.
To share a dashboard:
Select the dashboard you want to share.
Click the Dashboard Settings (three dots) icon and select Dashboard Settings.
In the Dashboard Settings page, use the Shared With drop-down.
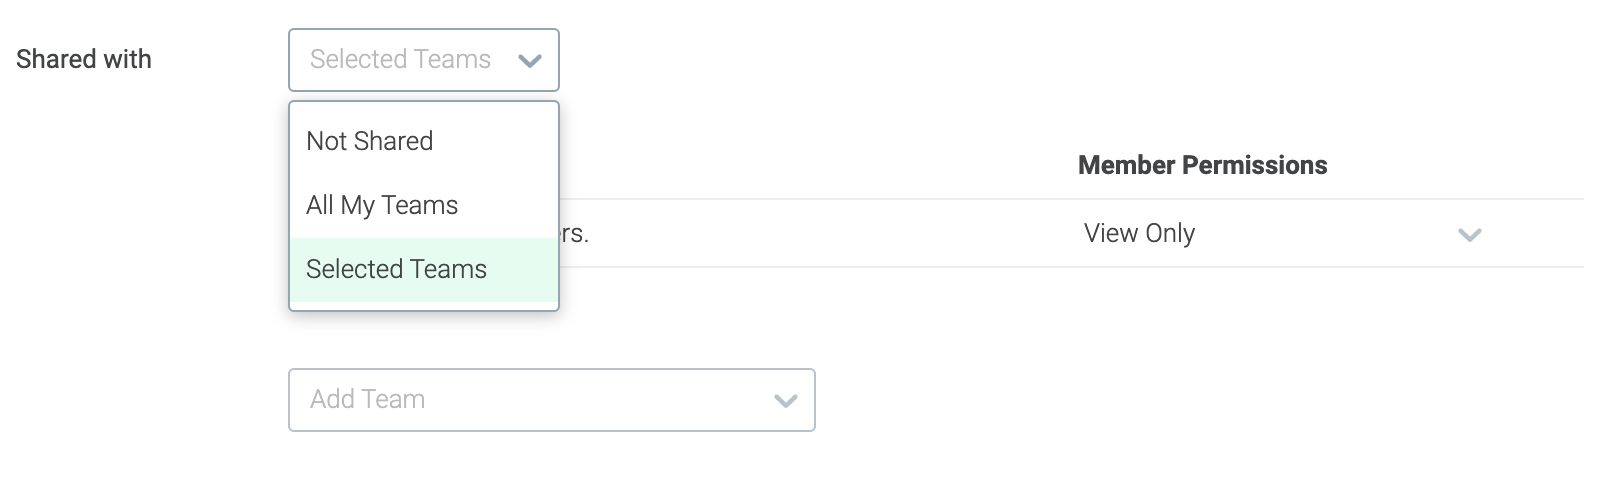
Select one of the three options:
Not Shared: If selected, the specified Dashboard cannot be shared with a team or selected team the owner is a member of.
All Teams: If selected, the owners of the Dashboard can share with all the teams that they are part of.
Selected Teams: If selected, the owner of the Dashboard can share with a selected list of teams. You can select one of the available teams in the drop-down, and select member permission:
View Only: This permission allows members to view the Dashboard.
Collaborator: A collaborator can edit the Dashboard.
Enable Public Sharing
You can share dashboards outside of the internal team by using public URLs. This allows external users to review the dashboard metrics while restricting access to changing panels and configurations. The scope parameters, including scope variables, are included in the Dashboard URL.
To enable sharing the public link of a dashboard, follow these steps:
- Select the dashboard you want to share, click the Dashboard Settings (three dots) icon, and select Dashboard Settings.
- In the Dashboard Settings page, enable the Public Sharing slider.
When enabled, the dashboard is visible with scope parameters to anyone with the link. If this setting is disabled, the link will no longer work, and the setting will need to be re-enabled and shared again in order for the dashboard to be accessed.
Transfer Dashboard Ownership
Dashboards have a single owner. Dashboard owners and administrators can transfer ownership of a dashboard through the UI.
General Guidelines
- When you delete a user through the UI, any shared dashboards they own or have created will be preserved by default, with the deactivated user still marked as the dashboard owner.
- Before you delete a user with the API, you must transfer any shared dashboards owned by the user to another user. Otherwise, the following error appears:
{"type":"bad_request","message":"User owns shared or public dashboard, cannot proceed with delete","details":[]}
- Administrators can only transfer dashboards belonging to other users if the dashboards are shared. Private dashboards cannot be seen by other users, including administrators, and therefore cannot be transferred.
- When editing a user, the administrator can transfer their shared dashboards to a new owner.
- Things to know before changing the dashboard ownership:
- It is a good practice to ensure that the new owner is a member of the same teams as the previous owner to avoid disrupting the flow.
- The administrator can preview the teams that will no longer be able to access the dashboard before confirming the transfer.
- It is not necessary for the new owner to be part of any teams the previous owner was part of, but in this case, the dashboard will no longer be shared with any of the teams it was shared with previously.
Transfer Ownership as an Admin
Log in to Sysdig Monitor and select Settings > Users.
Select the user from whom you want to transfer dashboard ownership.
Select the dashboards you want to re-assign.
Click Transfer Ownership.
The Transfer Dashboard Ownership modal appears.
Select a new user and click Transfer.
Transfer Ownership as a User
In the Dashboards module, select the relevant dashboard from the left panel.
Click the Settings (three dots) icon for the dashboard.
Select Transfer Ownership.
The Transfer Dashboard Ownership modal appears.
Select a new user.
Review the details.
The teams indicated with cross-out text are the ones that had access to the dashboard earlier and will lose access to it after the transfer.
The dashboard will also be visible to all the teams that the new owner is part of. If you are not part of the teams that the new owner is a member of, you will no longer have the visibility to the dashboard.
If everything looks ok, click Transfer.
Search in Dashboards
Use the / shortcut to invoke the panel search pane which enables you to find panels within a given dashboard. The search capabilities are:
- Search by metric name
- Search by label name
- Search by Panel title or description
When searching, partial names can be used, such as sysdig_container_ or Memory.
Define Minimum Interval for PromQL Queries
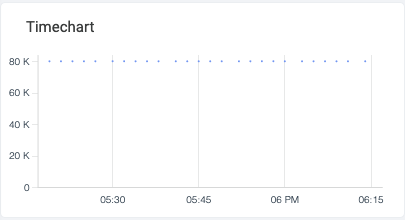
When working with PromQL queries you can use the $__interval variable and Sysdig will apply the most appropriate sampling corresponding to the time range you have selected. Sometimes you might have some metrics that report data with a coarser granularity and you want to apply an interval that is higher than the proposed.
For example, if you have a metric that reports data every 3m, and you have selected the 1h preset in the time navigation, the $__interval will be replaced with a time granularity of 10s. This will result in time charts with isolated data points instead of lines.
You can resolve this by setting the Default PromQL Query Min Interval option to 3m on the Dashboard Settings page.
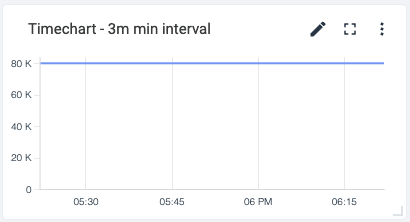
The value must be expressed as a time granularity, for example: 10s, 1m, 1h, and must be between 10s and 1d.
Note: If the proposed interval is greater than the minimum interval, the minimum interval will be ignored.
The setting will be applied to all the PromQL queries in the dashboard and it can be overridden by specifying a different value in the query options.
Use Case
Leverage Event Overlay for Increased Context
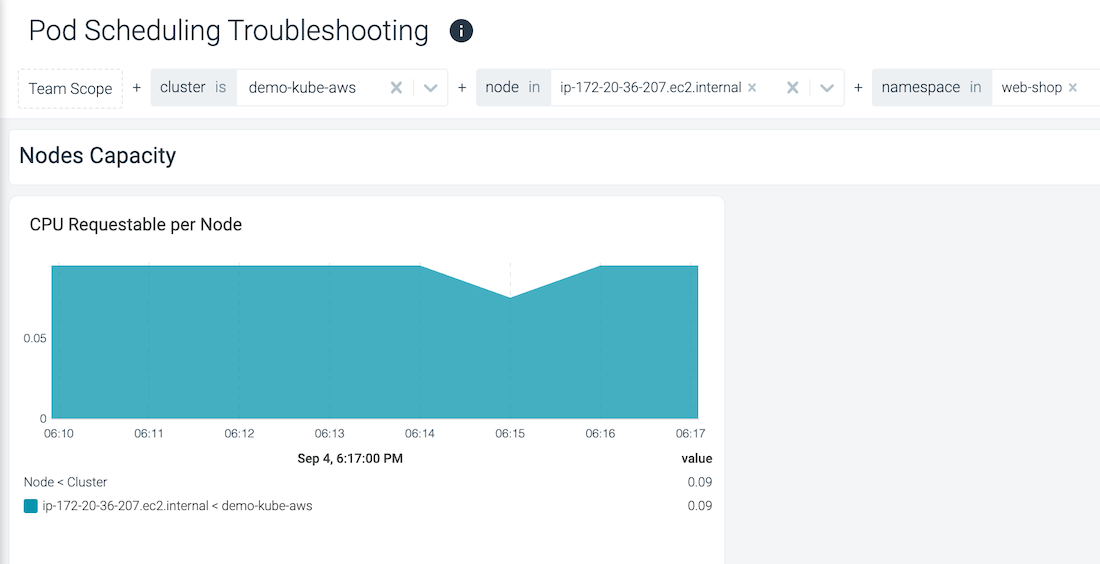
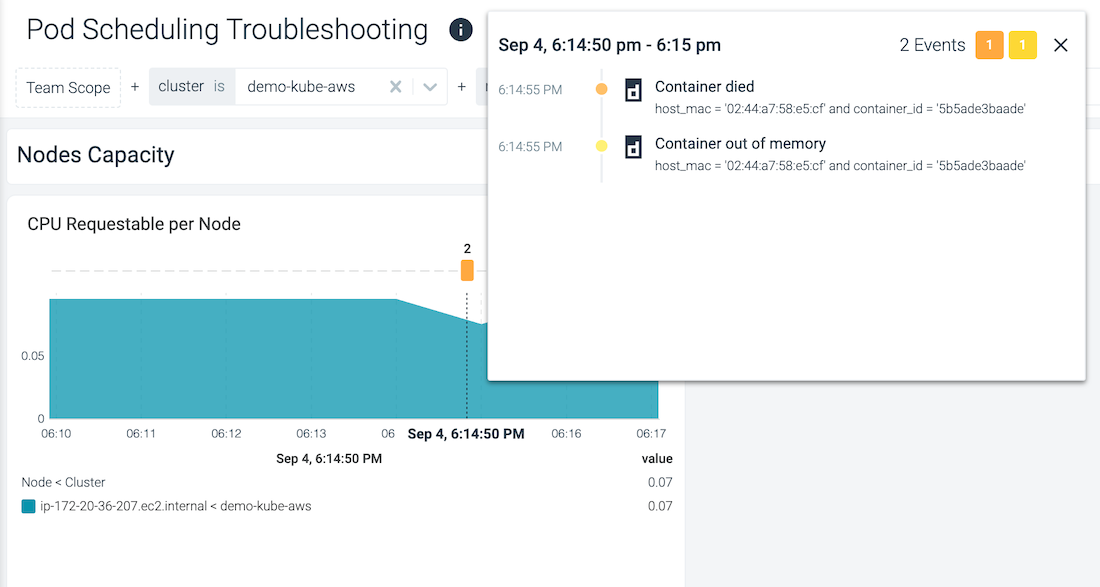
Examine events directly on the dashboard panels and correlate anomalies and issues with the events. The height of the event bucket is proportional to the number of events and the color indicates the highest severity of the events present.
The following example shows how the presence of the event overlay lets you quickly spot that the drop in CPU Requested per Node, is actually due to a container dying (due to an OOM).
| Without Context | With Context |
|---|---|
|
|
To configure the Event Overlay, select the Dashboard Settings (three dots) > Events Display.
The following options are available when configuring the Events Display:
| Option | Description |
|---|---|
| Filter | Filters events by the event search syntax and searched fields. |
| Scope | Determines whether the range of events displayed includes those for dashboard scope or team scope. |
| Severity | Determines whether only high severity events or all events are displayed. |
| Event Type | Determines what types of events to be displayed. The supported events types are alert, custom events, containers, or Kubernetes. |
| Status | Determines the state of events displayed. The supported status are Triggered, Resolved, Acknowledged, Un-acknowledged. |