Configure Alerts
Configure an Alert
You can open the Alert Editor to configure alerts from several places in the Sysdig Monitor UI:
- Alerts: Select New Alert or edit an existing alert.
- Metrics Explorer: Select Create Alert.
- An existing Dashboard: click the three-dot menu icon on a panel, and select Create Alert.
- An Event panel: Select Create Alert from Event.
- The Alerts Library: Select Enable Alert on a pre-defined template.
Alert Types
When you open the Alert Editor, you can select from a number of alert types, suitable for different use cases:
- Threshold (Previously Metric): Monitor your infrastructure by comparing any metric against user-defined thresholds
- Prometheus (Previously PromQL): Monitor your infrastructure with PromQL queries, maintaining full compatibility with OSS Prometheus.
- Event: Monitor your infrastructure by tracking specific events, and alert if the total number of occurrences exceeds a user-defined threshold
- Group Outlier: Monitor unusual patterns by detecting deviations from expected group behavior.
- Percentage of Change: Compare the percentage of change of a metric over two specific timeframes, such as comparing the last 5 minutes to the previous hour.
- Downtime: Monitor any type of entity - host, container, process, service, etc - and alert when the entity goes down.
The type of alert you choose will determine the sections and conditions you can configure in the Alert Editor.
Settings
In the Alerts Editor, configure the following parameters in the Settings section:
- Alert Severity: Select a priority. High, Medium, Low and Info.
- Alert Name: Specify a meaningful name that can uniquely represent the Alert you are creating. For example,
Production Cluster Failed Scheduling pods. - Description (optional): Add additional alert context
- Group (optional): Group alerts by assigning them to a specific group name. Alerts that have no group name will be added to the Default Group.
- Orphaned Alerts: Automatically deactivate orphaned alert occurrences and eliminate noise caused by outdated alerts triggered for entities that are no longer reporting data.
- Link to Dashboard: Select a dashboard that you might want to include in the alert notification.
- Link to Runbook: Specify the URL of a runbook.
Notification
In the Notifications section of the Alert Editor, you can configure alerts to forward to notification channels and configure the template that is sent.
Alerts are supported for the following notification channels:
- Amazon SNS
- Custom Webhook
- Google Chat
- IBM Cloud Functions
- IBM Event Notifications (IBM Only)
- Microsoft Teams
- OpsGenie
- PagerDuty
- Prometheus Alert Manager
- Slack
- Sysdig Team Email
- VictorOps
- Webhook
To configure an alert to forward to a notification channel, you must set up a notification channel first. To set up a notification channel, see Set up Notification Channels.
Notification Channel
To configure an alert to be sent to a notification channel:
Open the Alert Editor through one of the methods described in Configure an Alert and navigate to the Notifications section.
Select Add Channel.
Select a notification channel you have set up from the Notification Channel drop-down.
After [setting up a Notification Channel], the channel will appear on the Notification Channel drop-down list.
You can configure alerts for forwarding to multiple notification channels when the alert condition is met.
(Optional) Use the toggles and the time settings to get notified at a specific frequency when the notification is unresolved, and to receive a notification when it is resolved. For more details, see Resolution Notification.
Resolution Notification
Notification Channels that receive alert notifications can also receive resolution notifications when the alert condition is no longer met. Toggle Get Notified under When Resolved in order to forward resolution notifications so that incidents can be automatically closed in incident management channels such as Pagerduty or Opsgenie.
This setting allows an alert to override the notification channel’s default notification settings. If an override is not configured, the alert will inherit the default settings from the notification channel.
Customize Notifications
Configure Notification Template
Open the Alert Editor through one of the methods described in Configure an Alert
In the Notifications section, select Configure Notification Template.
The Configure Notification Template drawer opens.
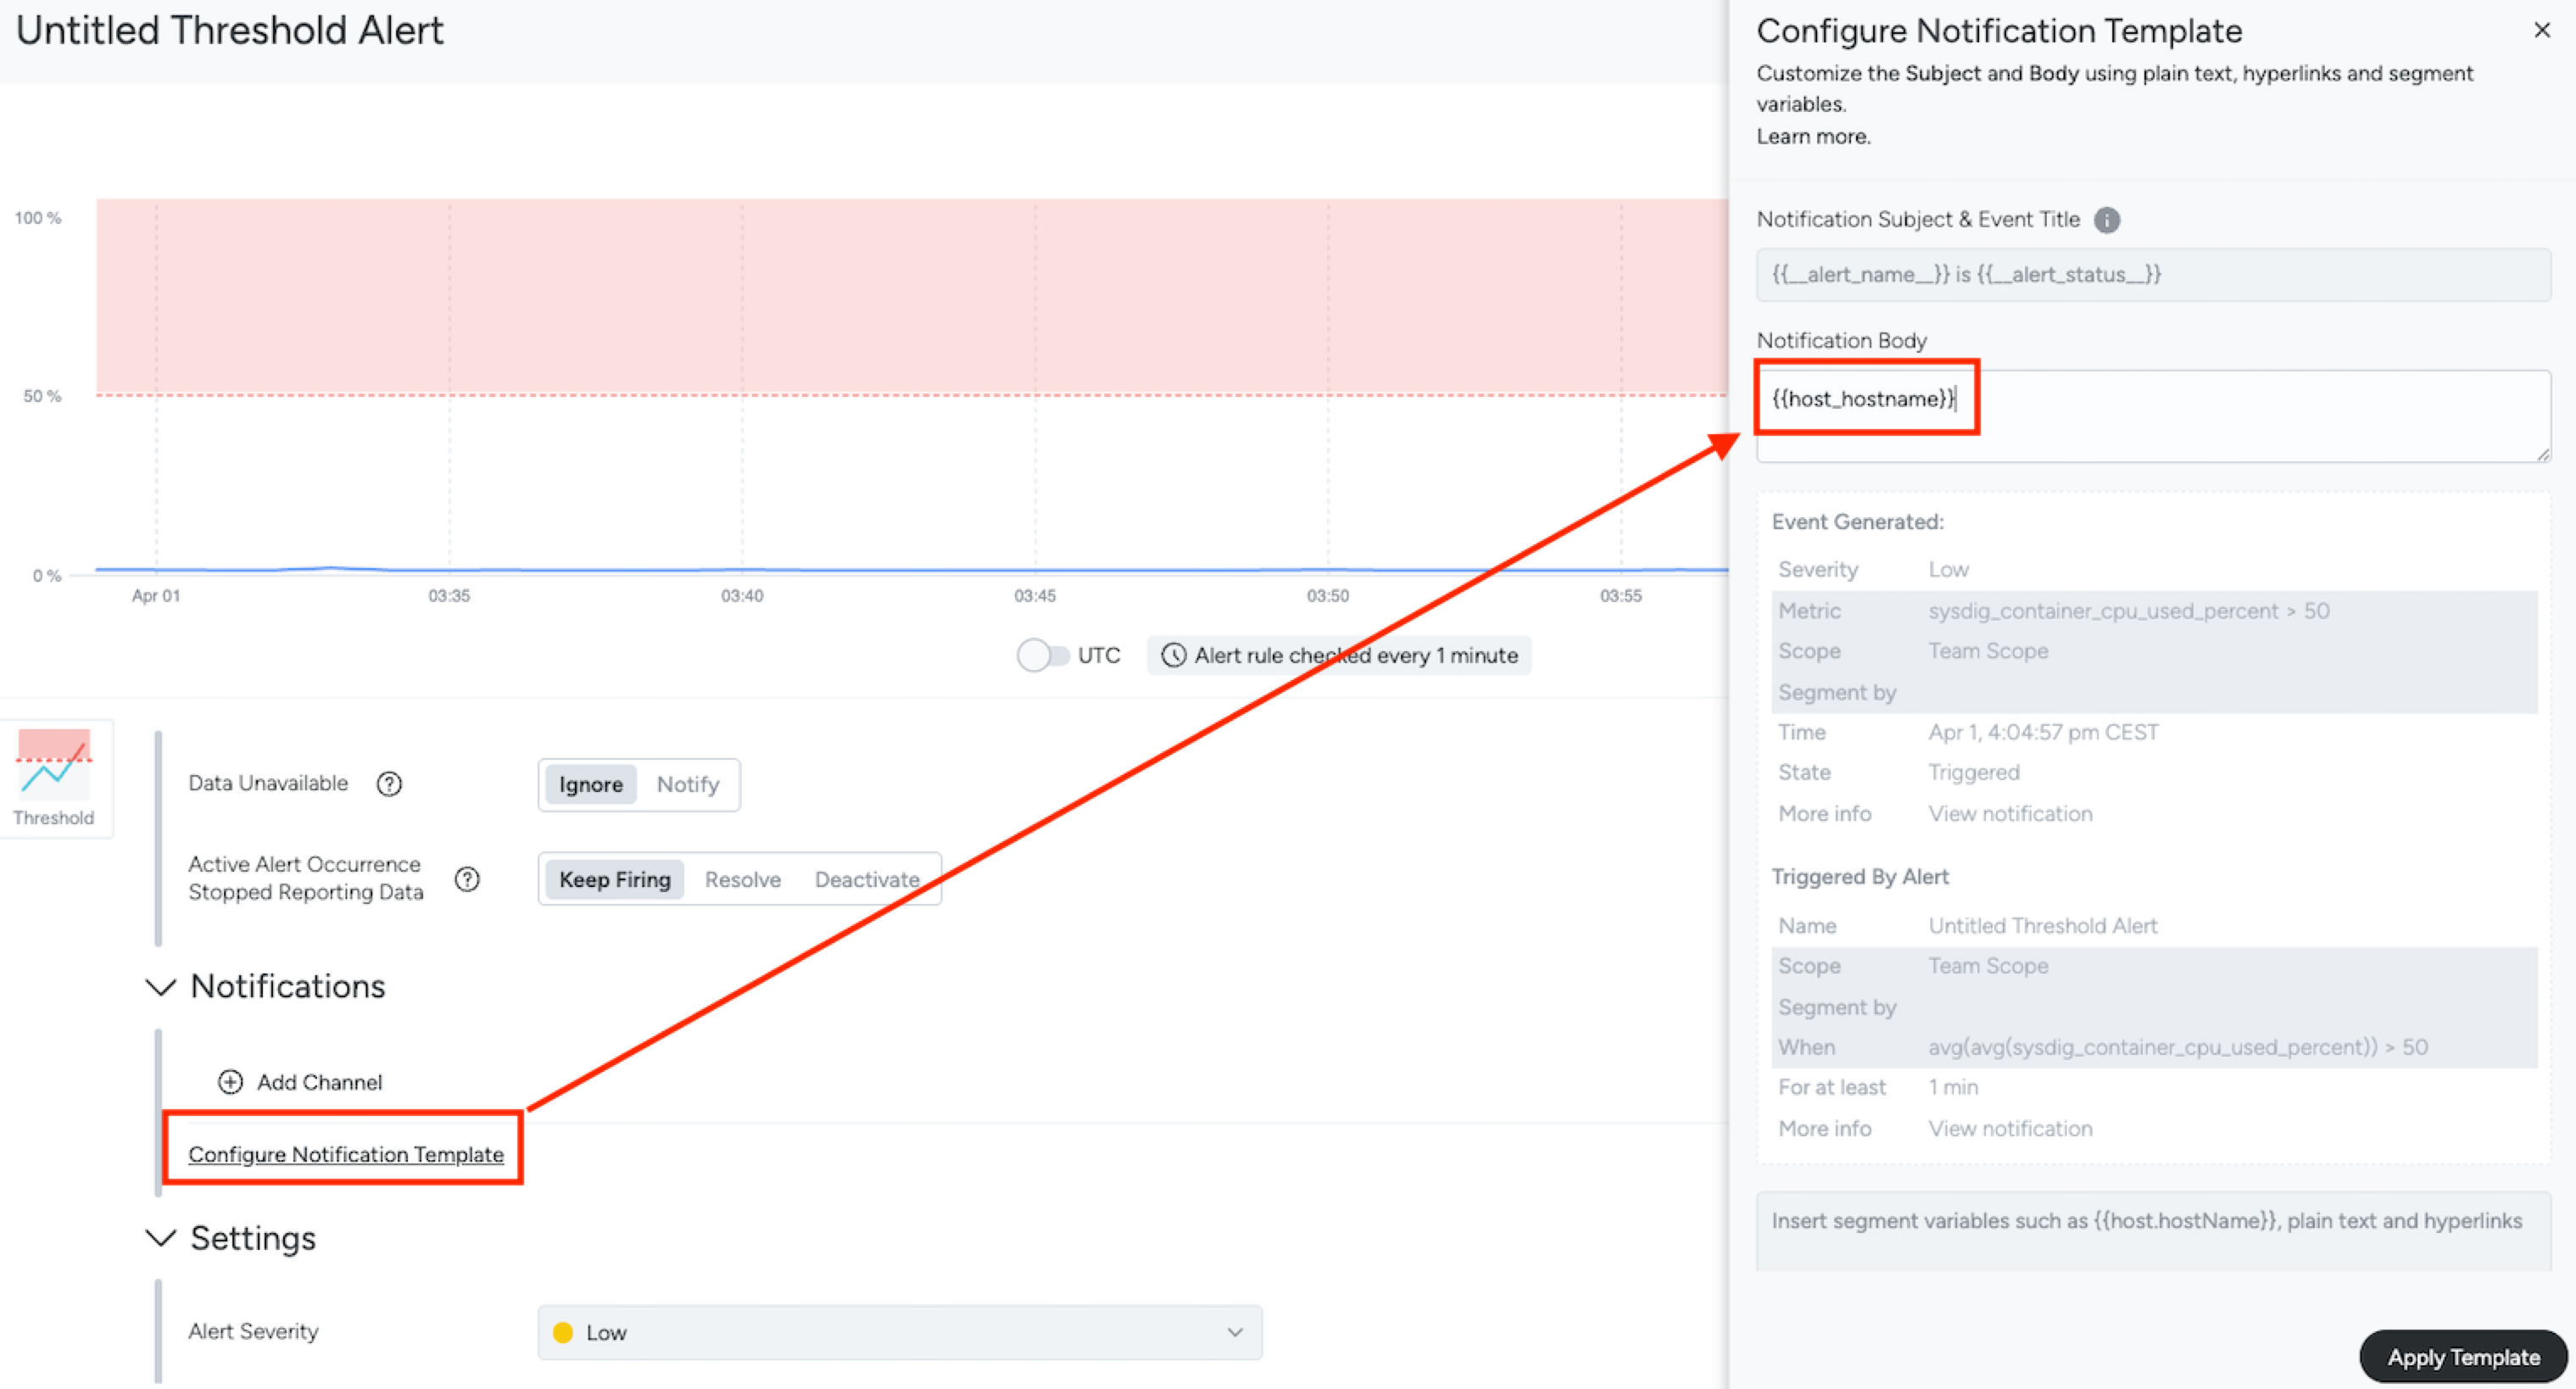
Customize the notification template. You can use custom text, hyperlinks, and dynamic variables to customize the template.
Title: Customize the notification subject and event title.
Body: Customize the text seen before (pre) and after (post) the body of the alert. The body is automatically generated by the alert.
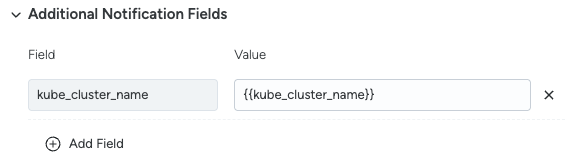
Additional Notification Fields: Optionally, define additional notification fields to be sent along with the notification.
- Field: Name of the field. It does not have to be the same as variable name used in value.
- Value: The field value. Supports custom text, hyperlinks, and dynamic variables.
Additional Notification Fields example:
Dynamic Variables
Dynamic variables assign themselves the value of the variable, which can continually change as the operation is evaluated. Autocomplete is available when you type double curly braces ({{) followed by initial characters of the variable name.
The following variable types are supported:
- Alert Rule Variables: Represent attributes of the alert rule definition. Prefixed with
alert.rule. - Alert Occurrence Variables: Represent variables related to an alert event generated when a rule is triggered. Prefixed with
alert.occurrence.
Variable Basics
- Variables must correspond to the segmentation values defined for the alert. For example, if an alert is segmented by
host_hostnameandcontainer_name, use{{ alert.occurrence.labels.host_hostname }}and{{ alert.occurrence.labels.container_name }}. - Variables must be enclosed in double curly braces (
{{ }}). - To use literal double curly braces in a template, prefix them with an escape character.
Example:
\{{Above 50% of CPU Usage}} - Text enclosed in double curly braces that is not a valid variable is replaced with an empty string.
Example:
{{DPService1}} is {{Above 50% of CPU Usage}}renders asis {{Above 50% of CPU Usage}}. - Variables are case-sensitive.
- Notification subjects will not show up on the Event feed.
- Using a variable that is not a part of the segment will trigger an error.
- When a variable is not resolved, the output will be “N/a”. No error will be reported.
Supported variables
| Variable | Description |
|---|---|
{{ alert.rule.id }} | The auto-generated unique alert identifier. |
{{ alert.rule.name }} | The configured alert name. |
{{ alert.rule.description }} | The configured alert description. |
{{ alert.rule.scope }} | The configured alert scope. |
{{ alert.rule.severity }} | The configured alert severity label. HIGH, MEDIUM, LOW, INFO. |
{{ alert.rule.url }} | The URL to the Sysdig Monitor page where the alert can be edited. |
{{ alert.rule.group_by }} | A JSON String array with all the labels on which the alert has been grouped by. This applies only to metric and event alerts. |
{{ alert.rule.condition }} | The configured alert main condition. This applies only to metric and event alerts. |
{{ alert.rule.warning_condition }} | The configured alert warning condition. This does not apply to Prometheus alerts. |
{{ alert.rule.labels }} | A JSON object mapping label names from the alert definition to their values. |
{{ alert.rule.timespan }} | The configured alert timespan. |
{{ alert.rule.range }} | The configured alert range. |
{{ alert.rule.duration }} | The configured alert duration. |
{{ alert.rule.observation_window }} | The configured alert observation window. |
{{ alert.rule.team_name }} | The team owner of the alert. |
{{ alert.rule.type }} | The configured alert type: MANUAL, EVENT, PROMETHEUS, FORM_BASED_PROMETHEUS, PERCENTAGE_OF_CHANGE, GROUP_OUTLIERS. |
{{ alert.rule.dashboard_links }} | URLs to the Alert’s dashboards. |
{{ alert.rule.dashboard_template_links }} | URLs to the Alert’s dashboard templates. |
{{ alert.rule.runbook_links }} | URLs to the Alert’s runbook. |
{{ alert.rule.annotations }} | Key-value pairs of Alert’s annotations. |
{{ alert.rule.group_outliers_algorithm }} | The Algorithm used to compute outliers in case of Group Outliers Alert type. MAD (Median Absolute Deviation) or DBSCAN (Density-Based Spatial Clustering of Applications with Noise). |
{{ alert.rule.mad_threshold }} | The configured Alert’s MAD threshold, in case of MAD algorithm. |
{{ alert.rule.mad_tolerance }} | The configured Alert’s MAD tolerance, in case of MAD algorithm. |
{{ alert.rule.dbscan_tolerance }} | The configured Alert’s DBSCAN tolerance, in case of DBSCAN algorithm. |
{{ alert.occurence.workflow_status }} | The current workflow status of the alert occurrence: Triggered, Resolved, Acknowledged, Unacknowledged. |
{{ alert.occurence.state }} | The current state of the alert occurrence event. Examples: ACTIVE: for triggered events and events under renotification; OK: for events in which the condition no longer occurs |
{{ alert.occurence.condition }} | The condition that made the alert occurrence trigger or resolve. |
{{ alert.occurence.condition_value }} | The value that made the alert condition trigger, modelled as a string. In case of a no data alert triggering, this field will be values with “No Data”. |
{{ alert.occurence.condition_value_raw }} | The raw value that made the alert condition trigger. |
{{ alert.occurence.id }} | Unique identifier associated with each alert occurrence. |
{{ alert.occurence.event_id }} | Identifier associated with an alert occurrence event in the event feed. |
{{ alert.occurence.username }} | The username of the user responsible for the triggering of the alert occurrence event, if applicable, such as in the cases of test notification triggering. |
{{ alert.occurence.active_since_minutes }} | The number of minutes the alert occurrence has been active, used in case of re-notifications. |
{{ alert.occurence.metrics }} | A JSON object with alert occurrence’s metrics. |
{{ alert.occurence.starts_at }} | The timestamp when the alert occurrence started, formatted as yyyy-MM-dd’T’HH:mm:ss.SSS’Z'. |
{{ alert.occurence.ends_at }} | The timestamp when the alert occurrence ended, formatted as yyyy-MM-dd’T’HH:mm:ss.SSS’Z’. Only available in case the alert occurrence has been resolved. |
{{ alert.occurence.url }} | The url to the alert occurrence event details page within Sysdig Monitor. |
{{ alert.occurence.capture_url }} | The url to the Alert occurrence capture. |
{{ alert.occurence.threshold }} | Specifies whether the event is a MAIN or THRESHOLD, respectively if it trigger for a main or warning condition. |
{{ alert.occurence.entity }} | The alert occurrence segment. |
{{ alert.occurence.trigger.timestamp }} | The timestamp in which the alert occurrence event fired, as an epoch long number in microseconds. |
{{ alert.occurence.trigger.metadata }} | JSON object, allowing the user to inspect the metric values that made the alert trigger or re-notify. |
{{ alert.occurence.resolved.timestamp }} | The timestamp in which the alert occurrence event resolved, as an epoch long number in microseconds. |
{{ alert.occurence.metadata }} | A JSON object allowing the user to inspect the metric values that made the alert resolve. |
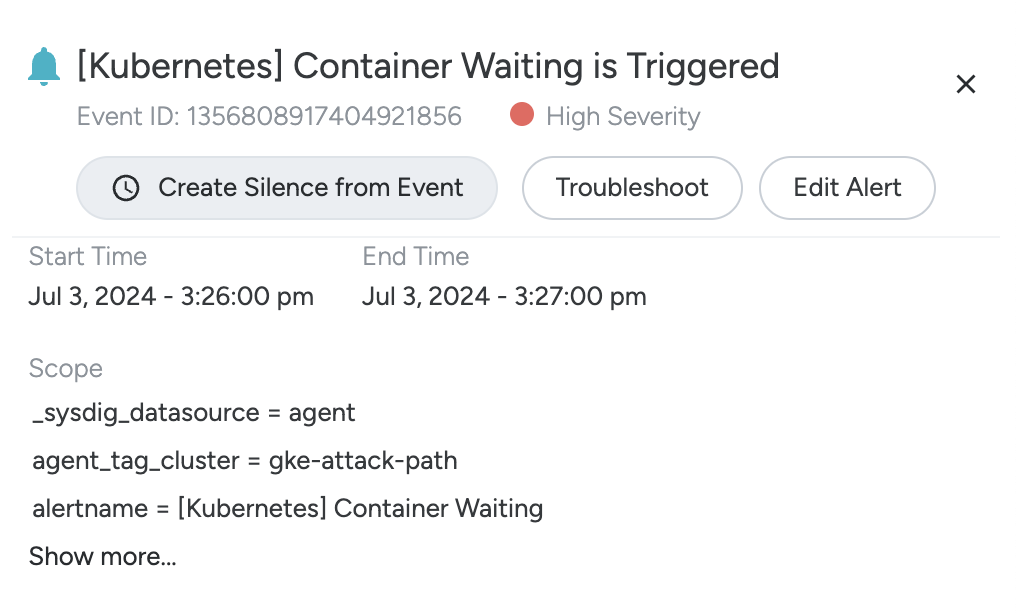
{{ alert.occurence.labels.<label_name> }} | <label_name> represents any available label that you can find on the corresponding Scope section of the matching Event in the Events feed. See screenshot below. Example labels from the scope in the screenshot: _sysdig_datasource = agent, agent_tag_cluster = demo-kube-aws, etc. |
The body of the notification message contains a Default Alert Template. It is the default alert notification generated by Sysdig Monitor. You may add free text, variables, or hyperlinks before and after the template.
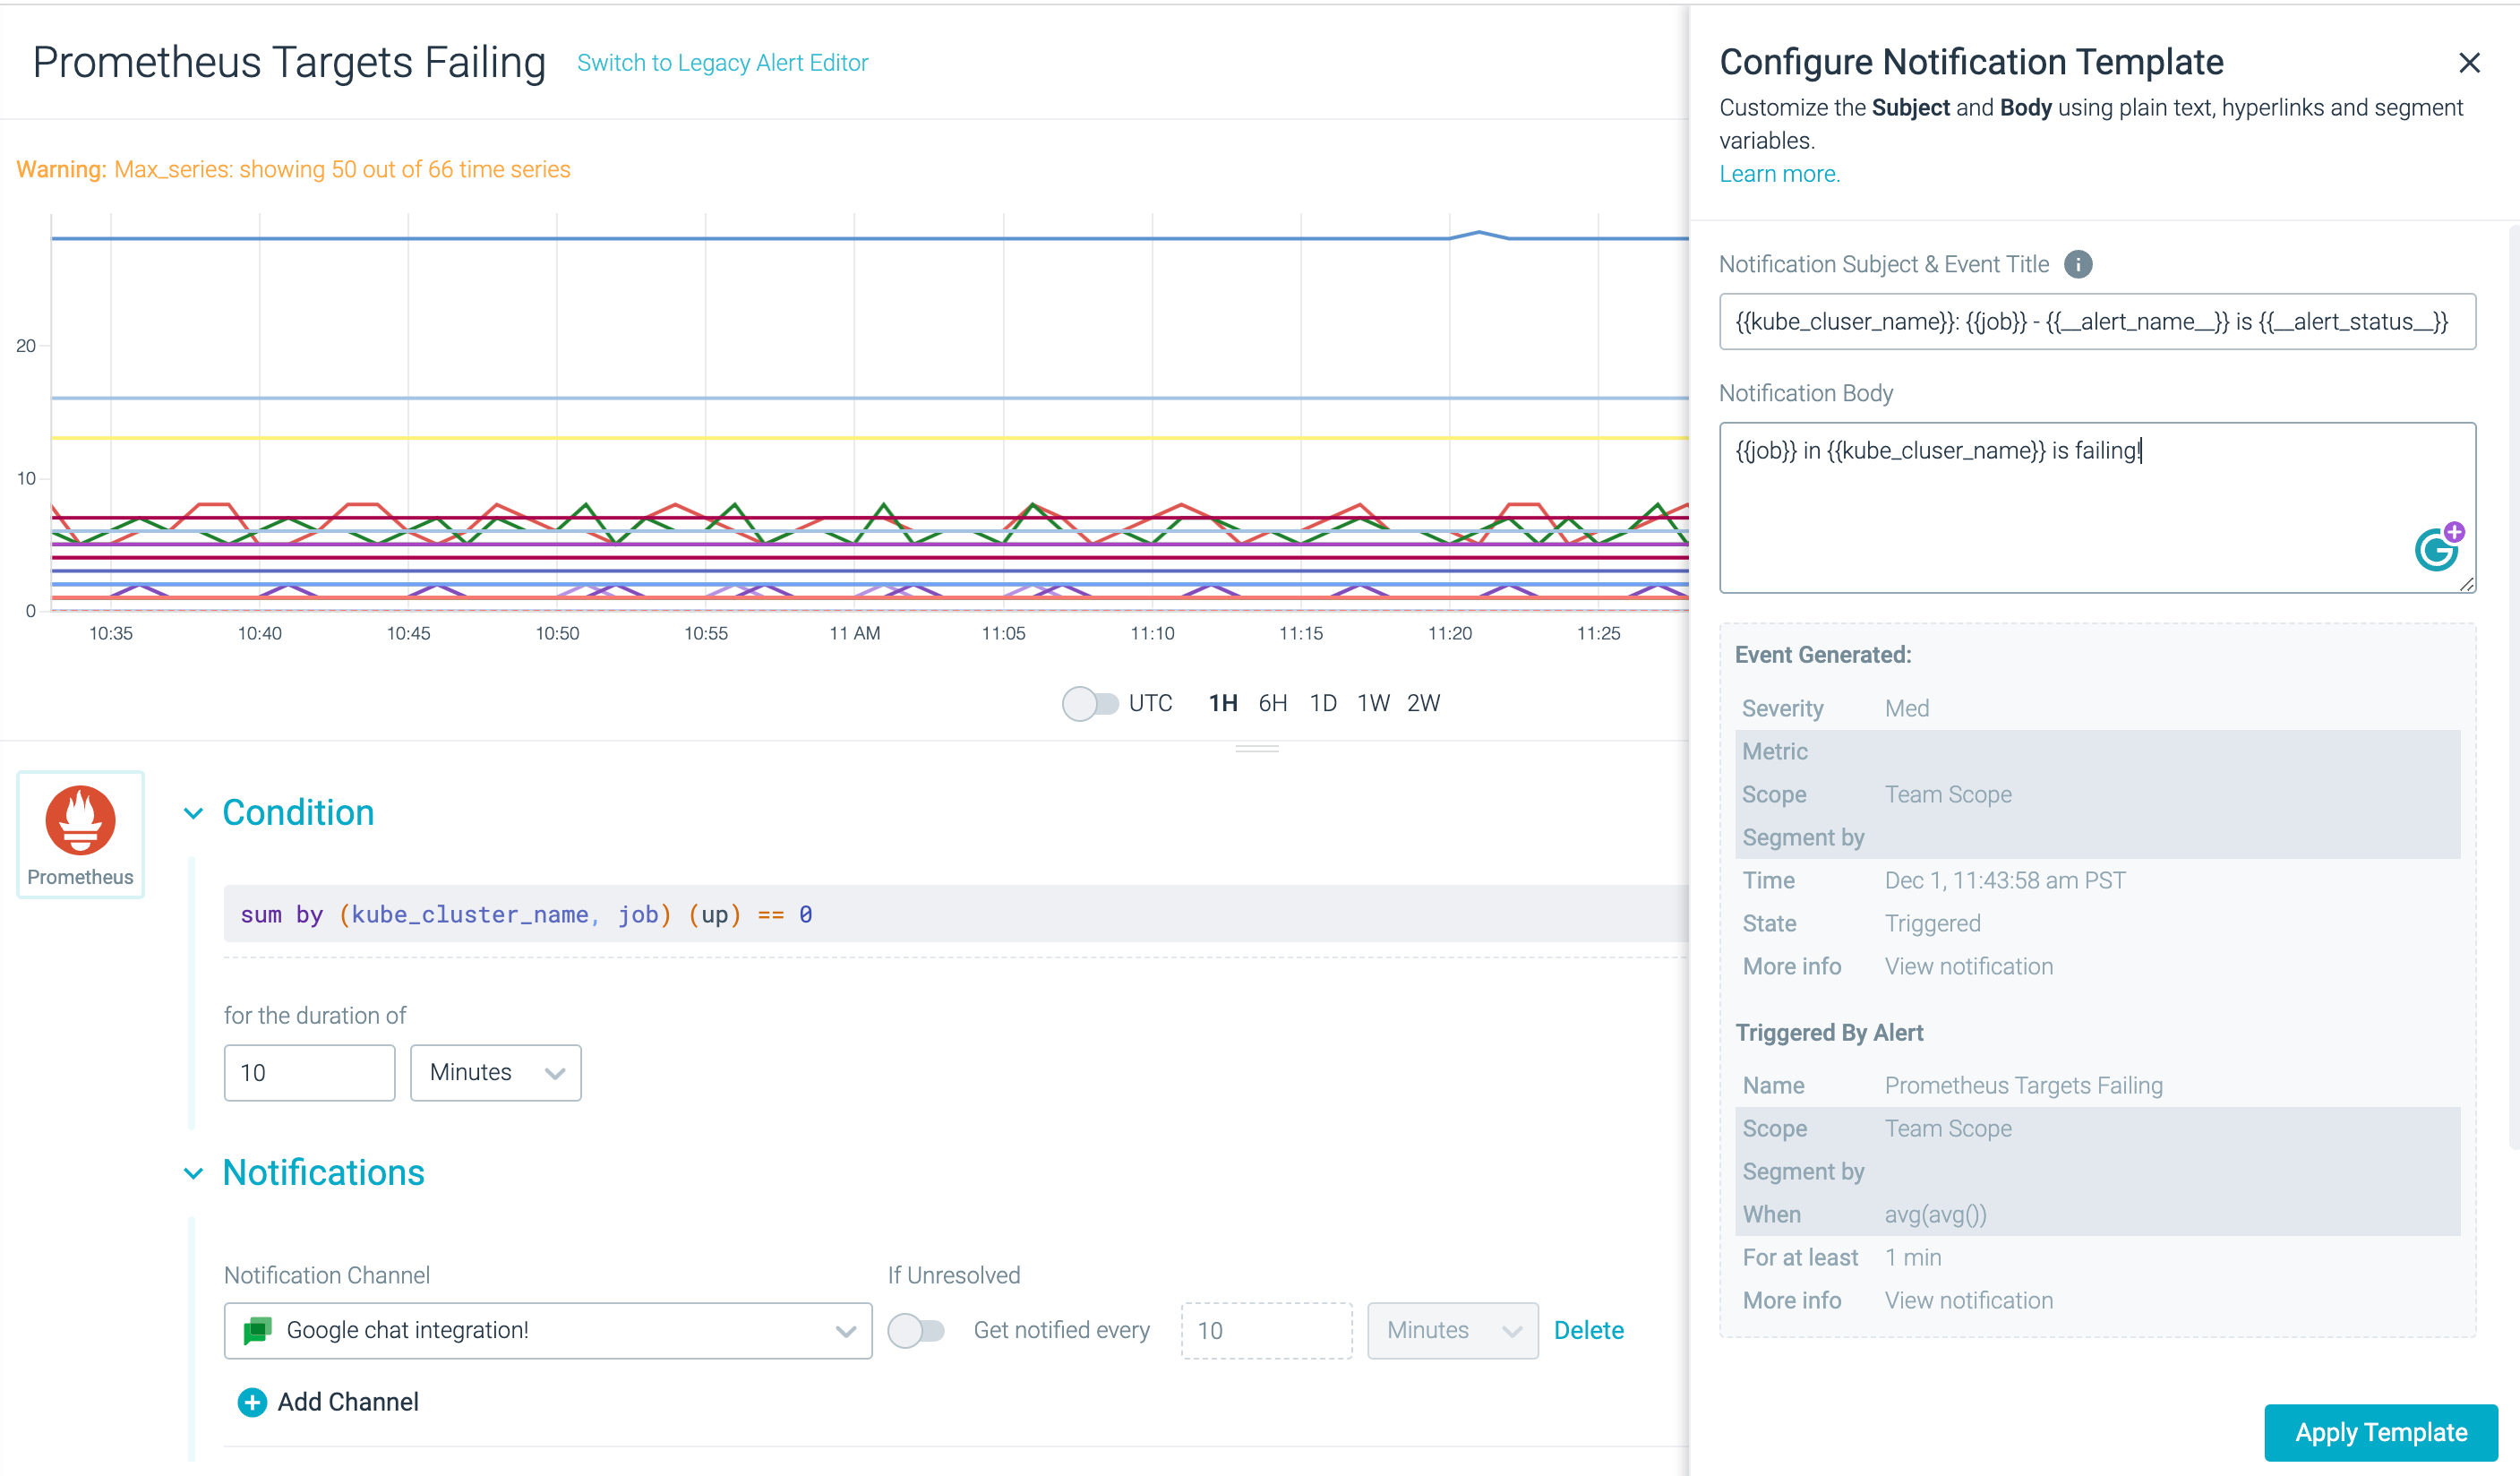
Example
The following example shows a notification template created to alert you on Failing Prometheus Jobs. Adding the following to the subject line helps you identify the problem area at a glance without having to read the entire notification body:
{{ alert.occurrence.labels.kube_cluster_name }}:{{ alert.occurrence.labels.job }} - {{ alert.rule.name }} is {{ alert.occurrence.workflow_status }}
Automate Deactivation or Resolution of Orphaned Alert Occurrences
Sysdig Monitor can automatically deactivate or resolve alert occurrences triggered by entities like hosts or containers that are no longer reporting data. This curbs noise from potentially outdated alert occurrences, ensuring that your alert notifications remain relevant.
By automatically deactivating or resolving orphaned alert occurrences, you can eliminate false positives and ensure that only alert occurrences from existing entities are reported in the system.
Prerequisites
Automatic Alert Deactivation is available for the following alert types:
- Threshold Alerts
- Group Outlier Alerts
- Downtime Alerts
Automatic Alert Resolution is available for the following alert types:
- Threshold Alerts
Configure Response to Lack of Data
To configure a response to a lack of alert occurrence data:
Log in to Sysdig Monitor.
Either Create an Alert or edit an existing alert of the supported types.
The Alert configuration page appears.
Under Settings, review responses to Active Alert Occurrence Stopped Reporting Data:
- Keep Firing: The alert occurrence will continue, even if no data is reported.
- Resolve: When alert occurrences are resolved rather than deactivated, notification channels and alert configurations determine whether a resolution notification should be sent.
- Deactivate: Deactivated alert occurrences will not send any notifications but will be marked in the event feed as deactivated.
Supported Aggregation Functions
The table below displays supported time aggregation functions, group aggregation functions, and relational operators:
| Time Aggregation Function | Group Aggregation Function | Relational Operator |
|---|---|---|
| timeAvg() | avg() | = |
| min() | min() | < |
| max() | max() | > |
| sum() | sum() | <= |
| not applicable | not applicable | >= |
| not applicable | not applicable | != |
Captures
Optionally, configure a Sysdig capture. Specify the following:
- Capture Enabled: Click the slider to enable Capture.
- Capture Duration: The period of time captured. The default time is 15 seconds. The capture time starts from the time the alert threshold was breached
- Capture Storage: The storage location for the capture files.
- Capture Name: The name of the capture file
- Capture Filter: Restricts the amount of trace information collected.
Sysdig capture files are not available for Event Alerts and Prometheus Alerts. See Captures for more information.
Consistent Alert Preview for Alert Rule Evaluation
Threshold Alerts, Event Alerts, and Prometheus Alerts provide an alert preview that accurately reflects alert rule checks. This aligns the data points in the alert preview with the actual alert evaluation intervals, ensuring a realistic representation of alert behavior, since each point in the alert preview corresponds to an actual alert rule check.
For scenarios where you need to view data in a different format from the alert rule checks, such as data in 10s intervals or a week-long alert preview, switch to Explore Mode. This mode provides the flexibility to view data at different granularities or over extended periods, even if these do not correspond to the specific intervals of alert check. Explore Mode does not apply to Event Alerts.
Evaluation Interval for Threshold Alerts and Prometheus Alerts
By default, alerts are evaluated every minute. However, if an alert has a range of 3 hours or more, it will be evaluated every 10 minutes instead. For instance, if you have configured a Threshold Alert to look at data “over the last 3 hours,” it will be evaluated every 10 minutes. The same applies to Prometheus Alerts like sum(rate(errors_total[3h])) > 100 which will also be evaluated every 10 minutes. Additionally, this means that re-notifications can only be as frequent as 10m for these alerts.
Please note that Threshold Alerts and Prometheus Alerts with ranges of 31 days or more are not supported.
| Query Range | Check Interval |
|---|---|
| up to 3h | 1m |
| up to 1d | 10m |
| up to 7d | 1h |
| up to 31d | 1d |
| 31d | Not Supported |