Use Labels
Labels are used to identify and differentiate characteristics of a metric, allowing them to be aggregated or filtered in Explore, Dashboards, Alerts, and Captures. Labels can be used in different ways:
To group infrastructure objects into logical hierarchies displayed in Explore (called groupings).
For more information, see Groupings.
To split aggregated data into segments.
For more information, see Segments.

There are two types of labels:
Infrastructure labels
Metric descriptor labels
Infrastructure Labels
Infrastructure labels are used to identify objects or entities within the infrastructure that a metric is associated with, including hosts, containers, and processes. An example label is shown below:
Sysdig Notation
kubernetes.pod.name
Prometheus Notation
kubernetes_pod_name
The table below outlines what each part of the label represents:
| Example Label Component | Description |
|---|---|
kubernetes | The infrastructure type. |
pod | The object. |
name | The label key. |
Infrastructure labels are obtained from the infrastructure (including from orchestrators, platforms, and the runtime processes), and Sysdig automatically builds a relationship model using the labels. This allows users to create logical hierarchical groupings to better aggregate the infrastructure objects in the Explore module.
For more information on groupings, refer to the Groupings.
Metric Descriptor Labels
Metric descriptor labels are custom descriptors or key-value pairs applied directly to metrics, obtained from integrations like StatsD, Prometheus, and JMX. Sysdig automatically collects custom metrics from these integrations and parses the labels from them. Unlike infrastructure labels, these labels can be arbitrary and do not necessarily map to any entity or object.
Metric descriptor labels can only be used for segmenting, not grouping or scoping.
An example metric descriptor label is shown below:
website_failedRequests:20|region='Asia', customer_ID='abc'
The table below outlines what each part of the label represents:
| Example Label Component | Description |
|---|---|
website_failedRequests | The metric name. |
| 20 | The metric value. |
| region=‘Asia’, customer_ID=‘abc’ | The metric descriptor labels. Multiple key-value pairs can be assigned using a comma-separated list. |
Sysdig recommends not using labels to store dimensions with high cardinalities (numerous different label values), such as user IDs, email addresses, URLs, or other unbounded sets of values. Each unique key-value label pair represents a new time series, which can dramatically increase the amount of data stored.
Groupings
Groupings are hierarchical organizations of labels, allowing you to organize your infrastructure views in Explore in a logical order.
To access Groupings from Explore:
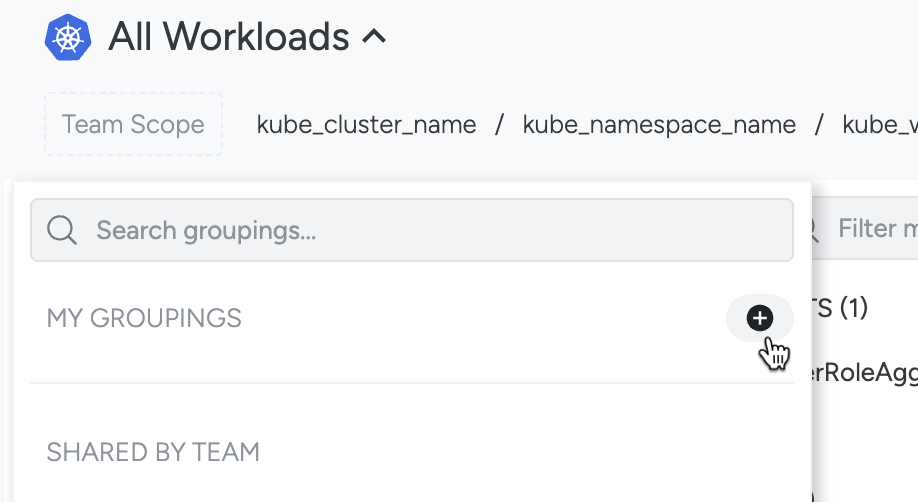
Select the name of the current grouping in the top left corner.
The Grouping drop-down will open.
Click + beside My Groupings.
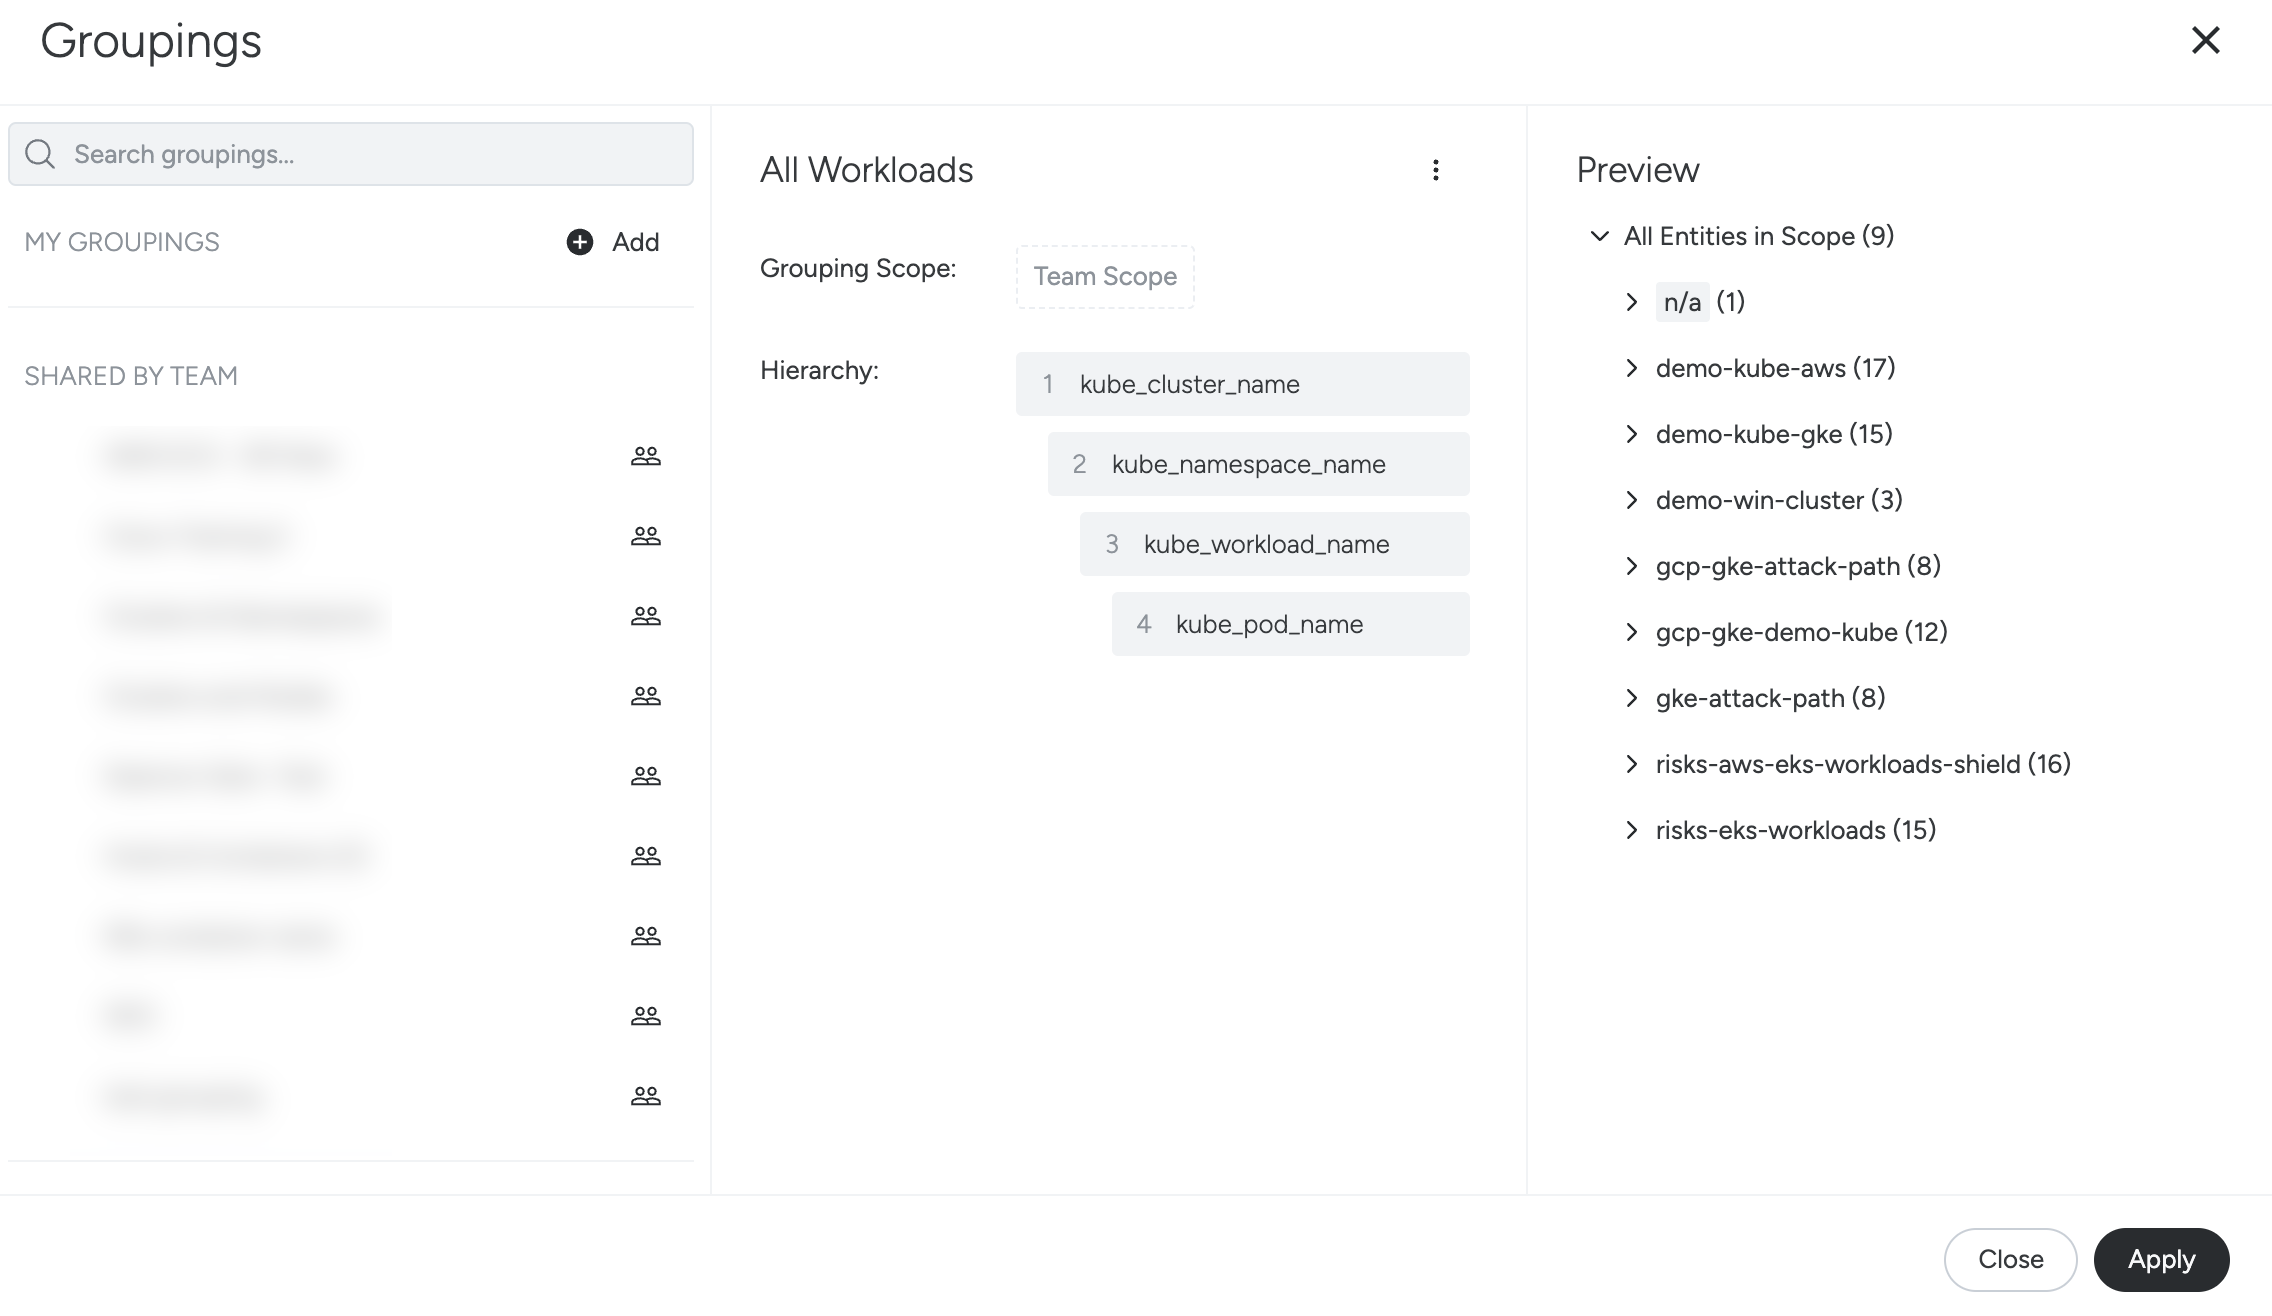
The Groupings Panel will open.
Here, you can add a new grouping, create custom groupings, and see a preview.
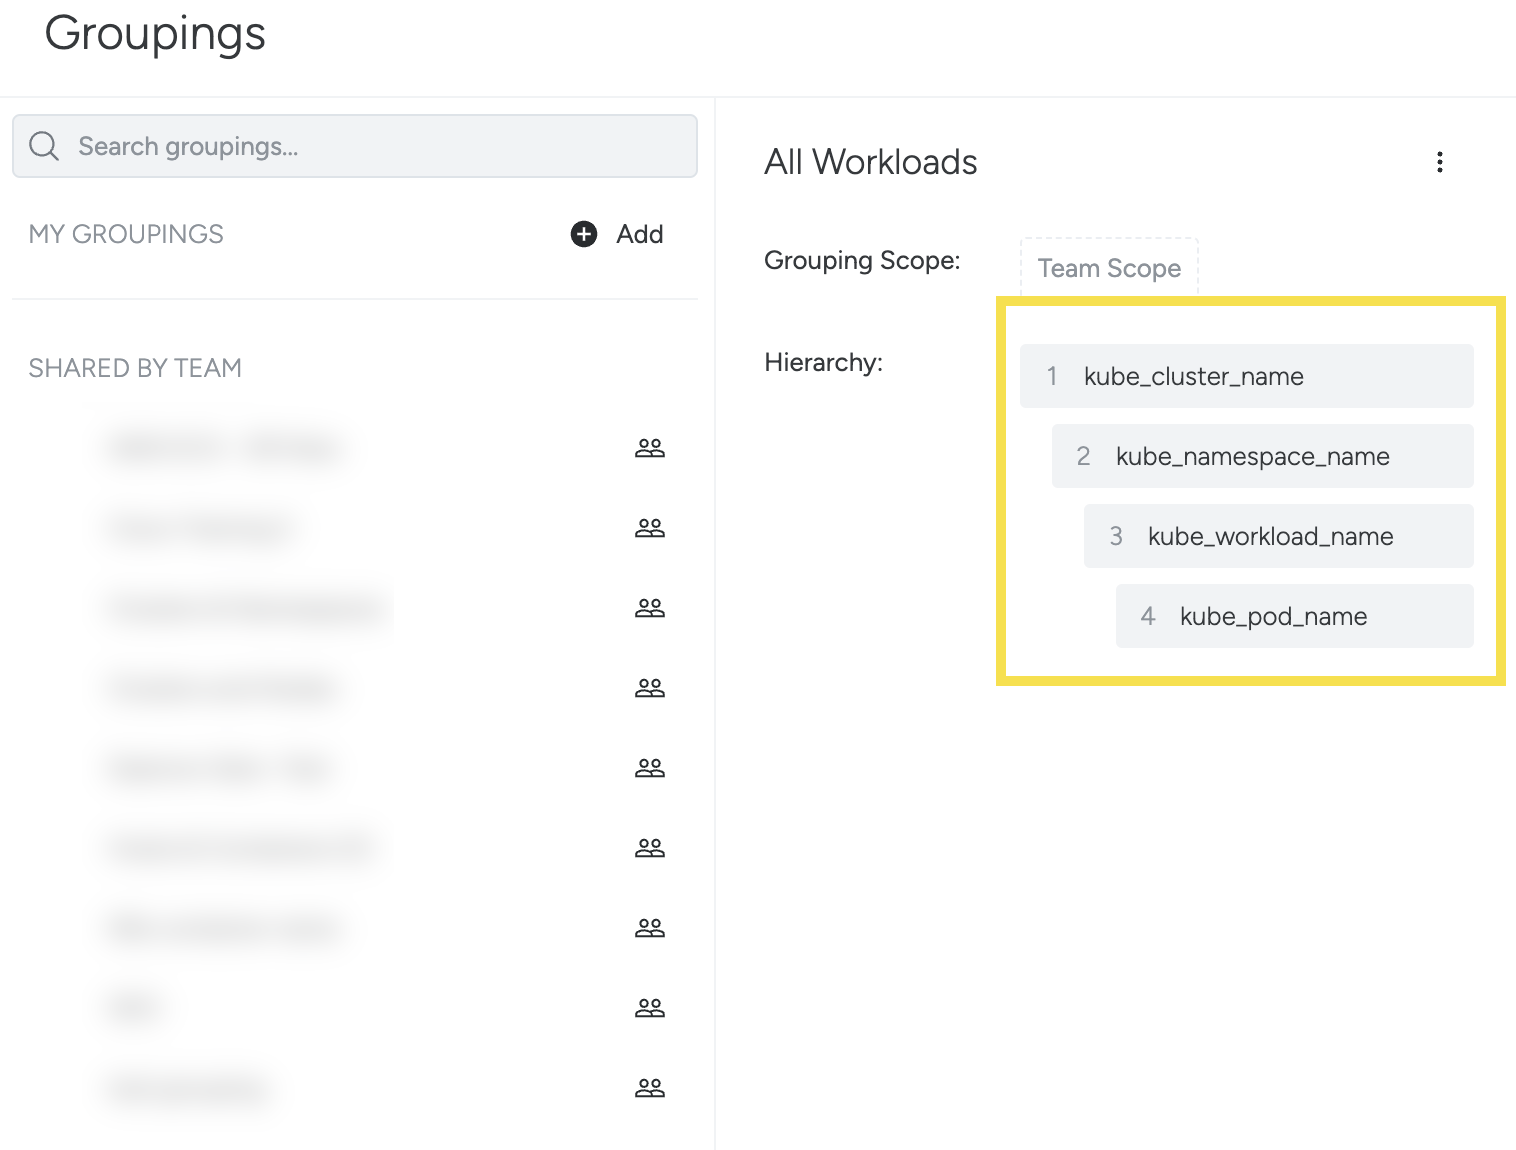
The example above groups the infrastructure into four levels. This results in a tree view in the Explore module with four levels, with rows for each infrastructure object applicable to each level.
As each label is selected, Sysdig Monitor automatically filters out labels for the next selection that no longer fit the hierarchy, to ensure that only logical groupings are created.
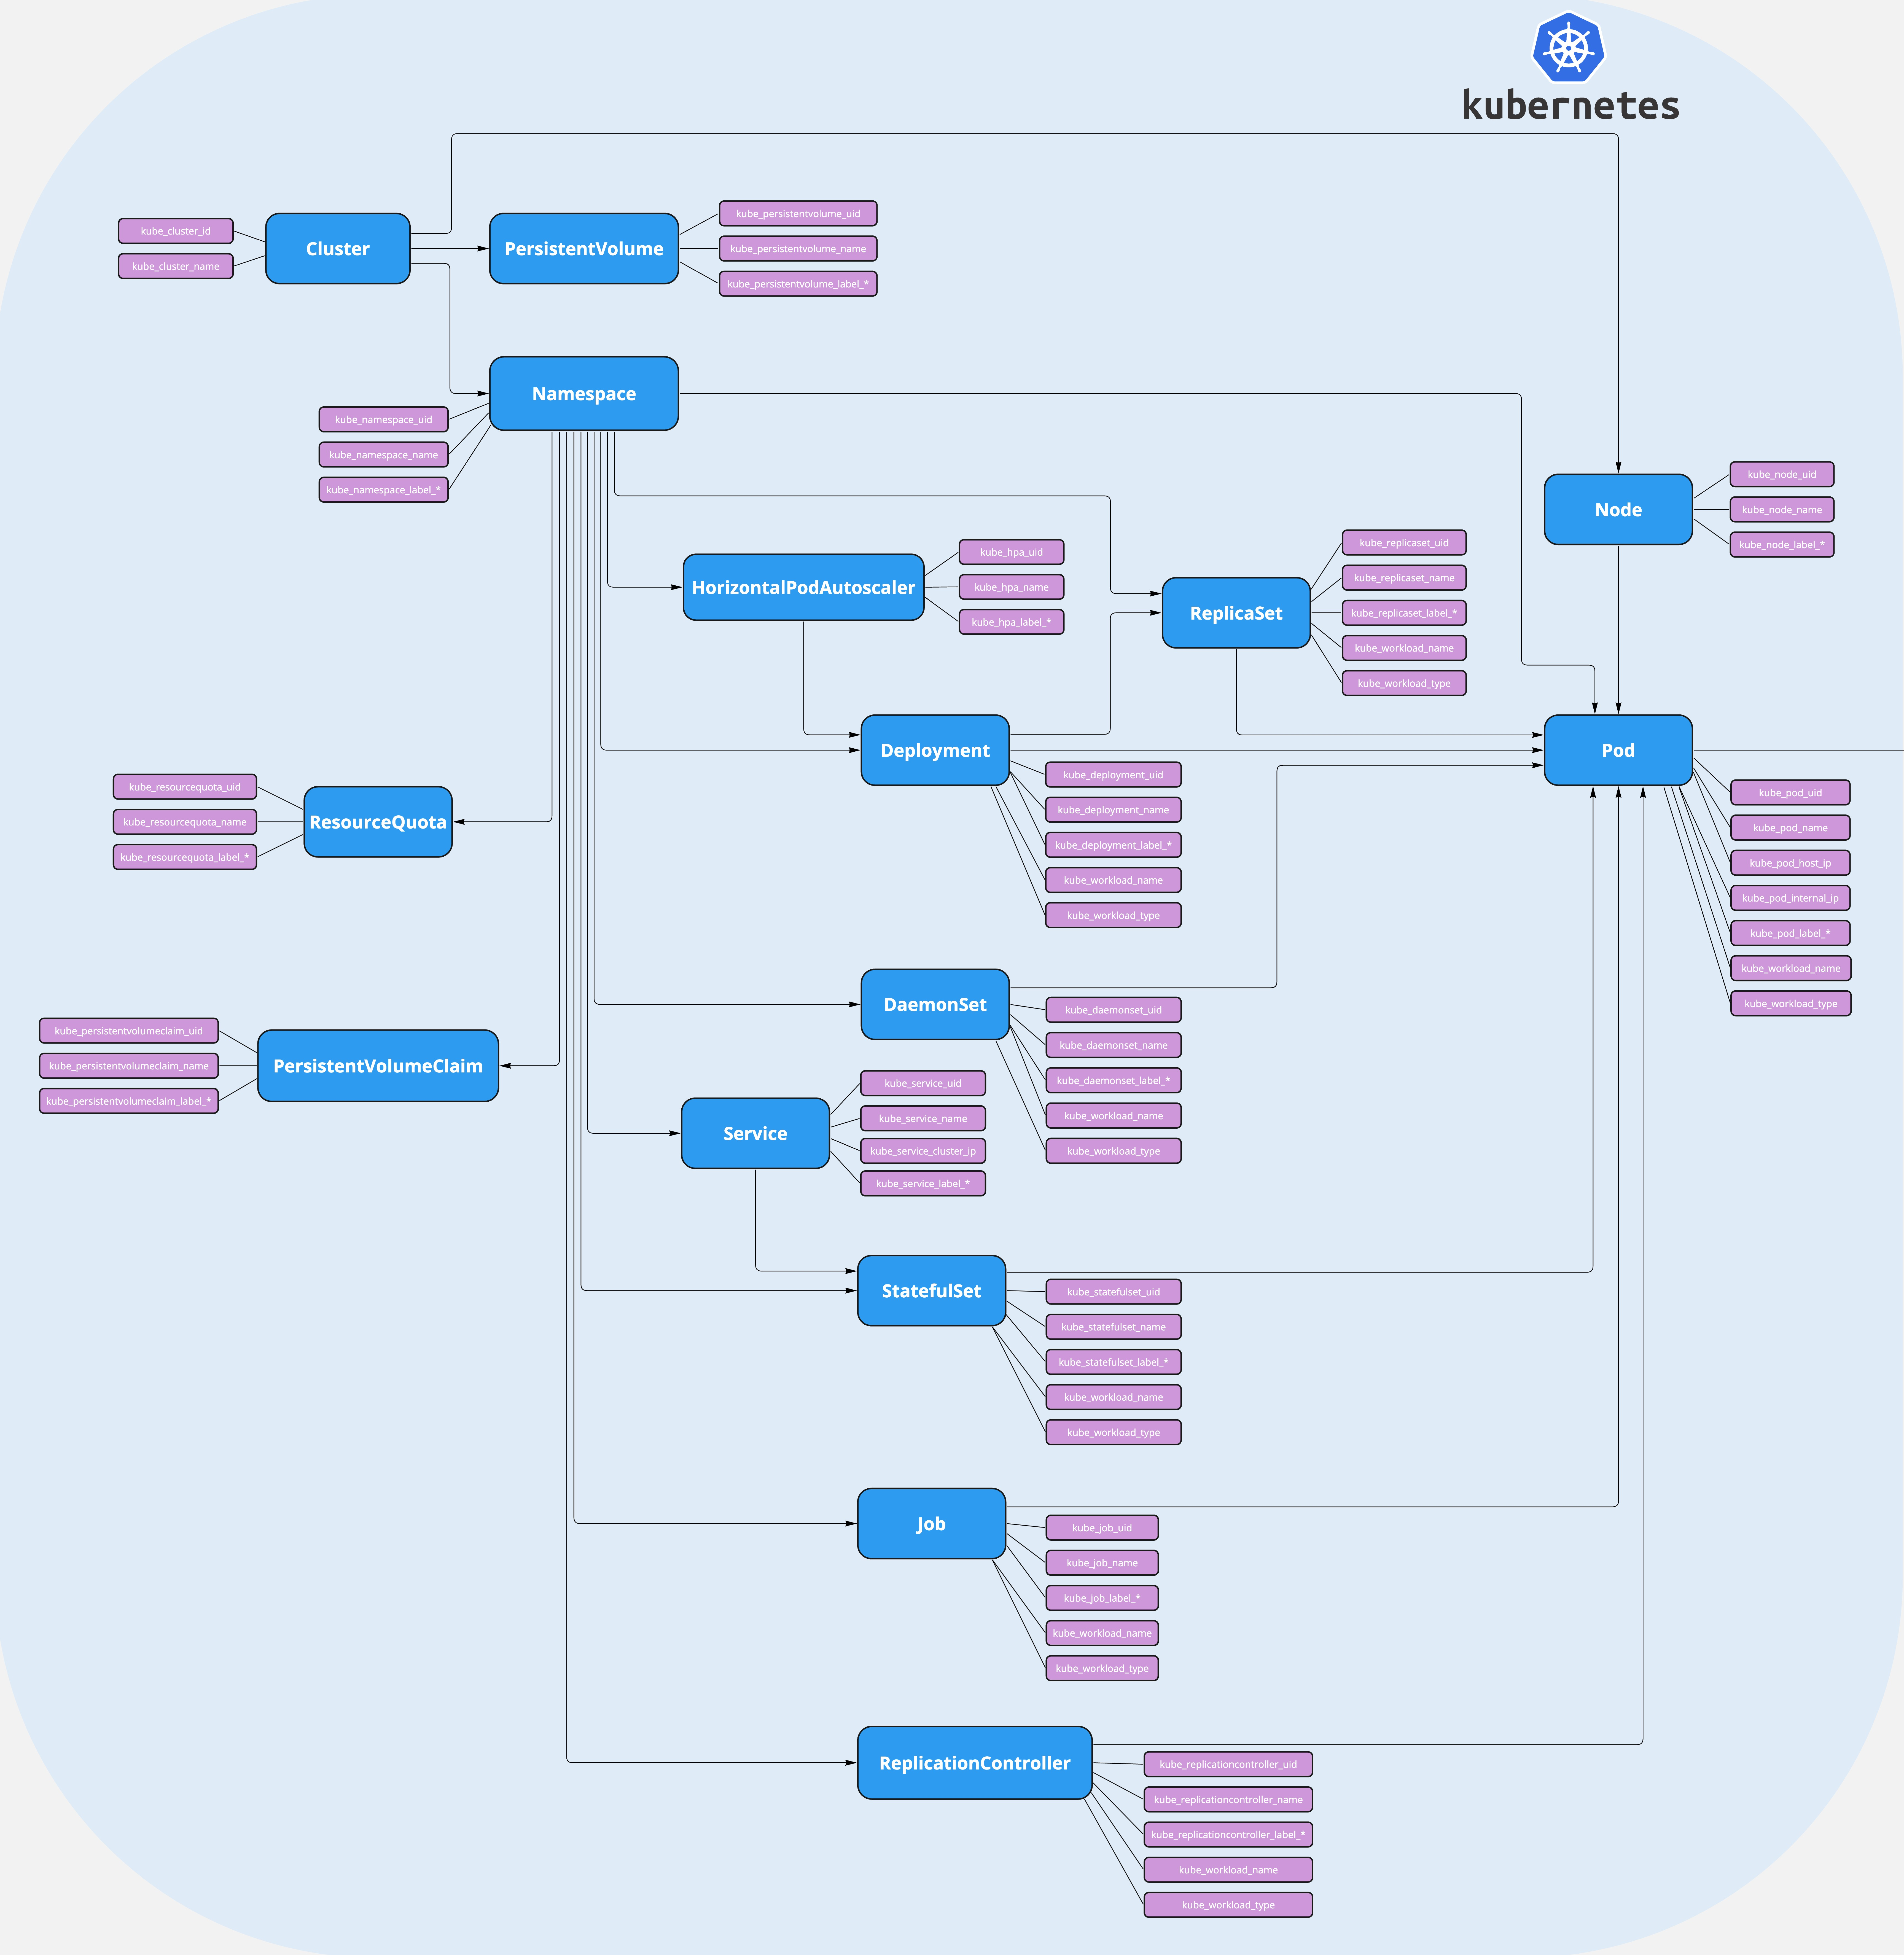
The example below shows the logical hierarchy structure for Kubernetes:
Clusters: Cluster > Namespace > Replicaset > Pod
Namespace: Cluster > Namespace > HorizontalPodAutoscaler > Deployment > Pod
Daemonsets : Cluster > Namespace > Daemonsets > Pod
Services: Cluster > Namespace > Service > StatefulSet > Pod
Job: Cluster > Namespace > Job > Pod
ReplicationController: Cluster > Namespace > ReplicationController > Pod
The default groupings are immutable: They cannot be modified or deleted. However, you can make a copy of them that you can modify.
Unified Workload Labels
Sysdig provides the following labels to help improve your infrastructure organization and troubleshooting easier.
kubernetes_workload_name: Displays all the Kubernetes workloads and indicates what type and name of workload resource (deployment, daemonSet, replicaSet, and so on) it is.
kubernetes_workload_type: Indicates what type of workload resource (deployment, daemonSet, replicaSet, and so on) it is.
The availability of these labels also simplifies Groupings. You do not need different groupings for each type of deployment, instead, you have a single grouping for workloads.
The labels allow you to segment metrics, such as sysdig_host_cpu_cores_used_percent , by kubernetes_workload_name to see CPU cores usage for all the workloads, instead of having a separate query for segmenting by kubernetes_deployment_name, kubernetes_replicaSet_name , and so on.
For more införmation, see Groupings.
Scopes
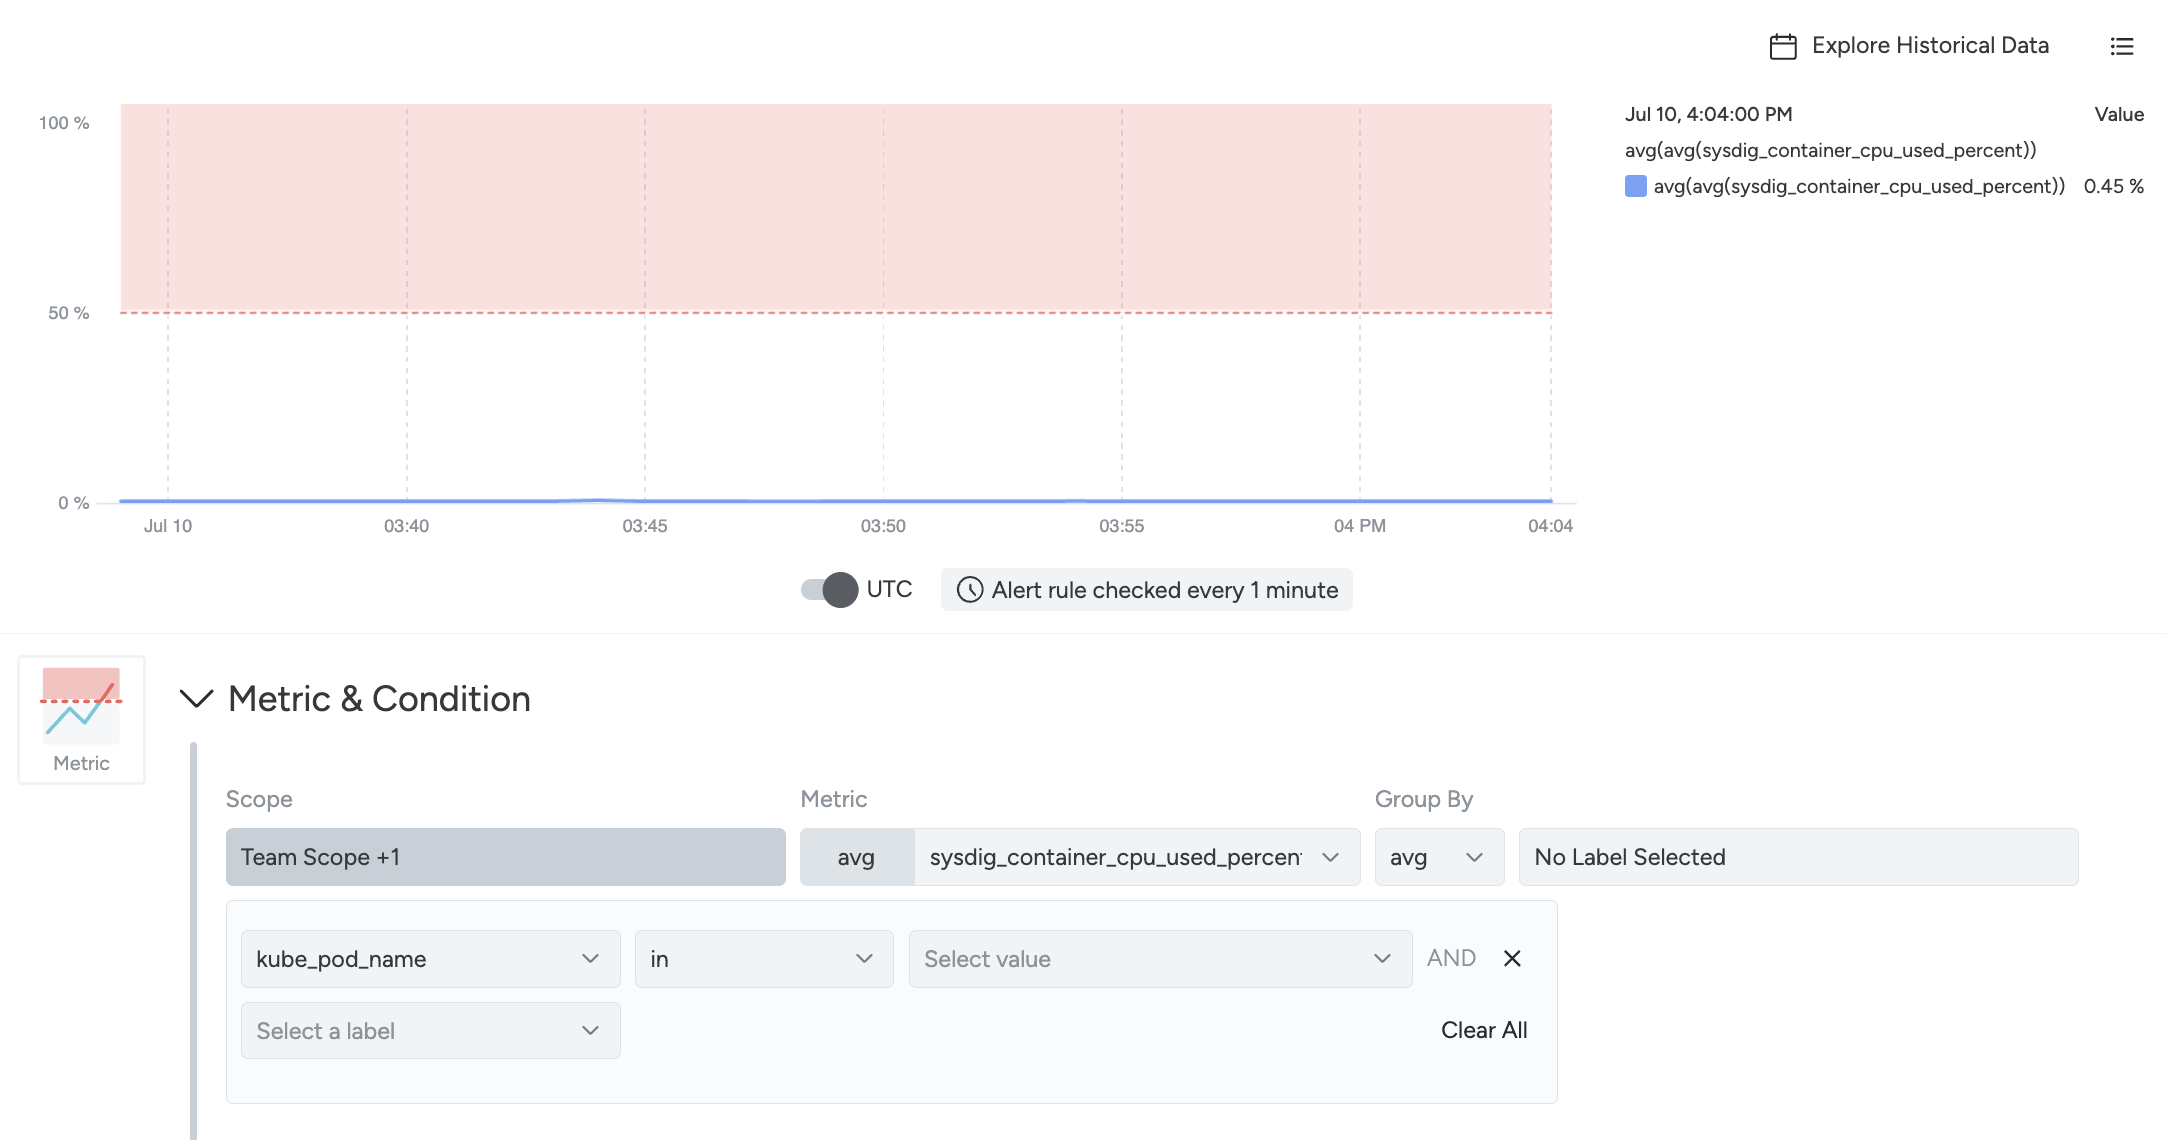
A scope is a collection of labels that are used to filter out or define the boundaries of a group of data points when creating dashboards, dashboard panels, alerts, and teams. An example scope is shown below:

In the example above, the scope is defined by two labels with operators and values defined. The table below defines each of the available operators.
| Operator | Description |
|---|---|
| is | The value matches the defined label value exactly. |
| is not | The value does not match the defined label value exactly. |
| in | The value is among the comma-separated values entered. |
| not in | The value is not among the comma-separated values entered. |
| contains | The label value contains the defined value. |
| does not contain | The label value does not contain the defined value. |
| starts with | The label value starts with the defined value. |
The scope editor provides dynamic filtering capabilities. It restricts the scope of the selection for subsequent filters by rendering valid values that are specific to the previously selected label. Expand the list to view unfiltered suggestions. At run time, users can also supply custom values to achieve more granular filtering. The custom values are preserved. Note that changing a label higher up in the hierarchy might render the subsequent labels incompatible. For example, changing the kubernetes_namespace_name > kubernetes_deployment_name hierarchy to swarm_service_name > kubernetes_deployment_name is invalid as these entities belong to different orchestrators and cannot be logically grouped.
Dashboards and Panels
Dashboard scopes define the criteria for what metric data will be included in the dashboard’s panels. To see a dashboard’s scope, select it from the Dashboards module. The current dashboard’s scope can be seen at the top of the dashboard:
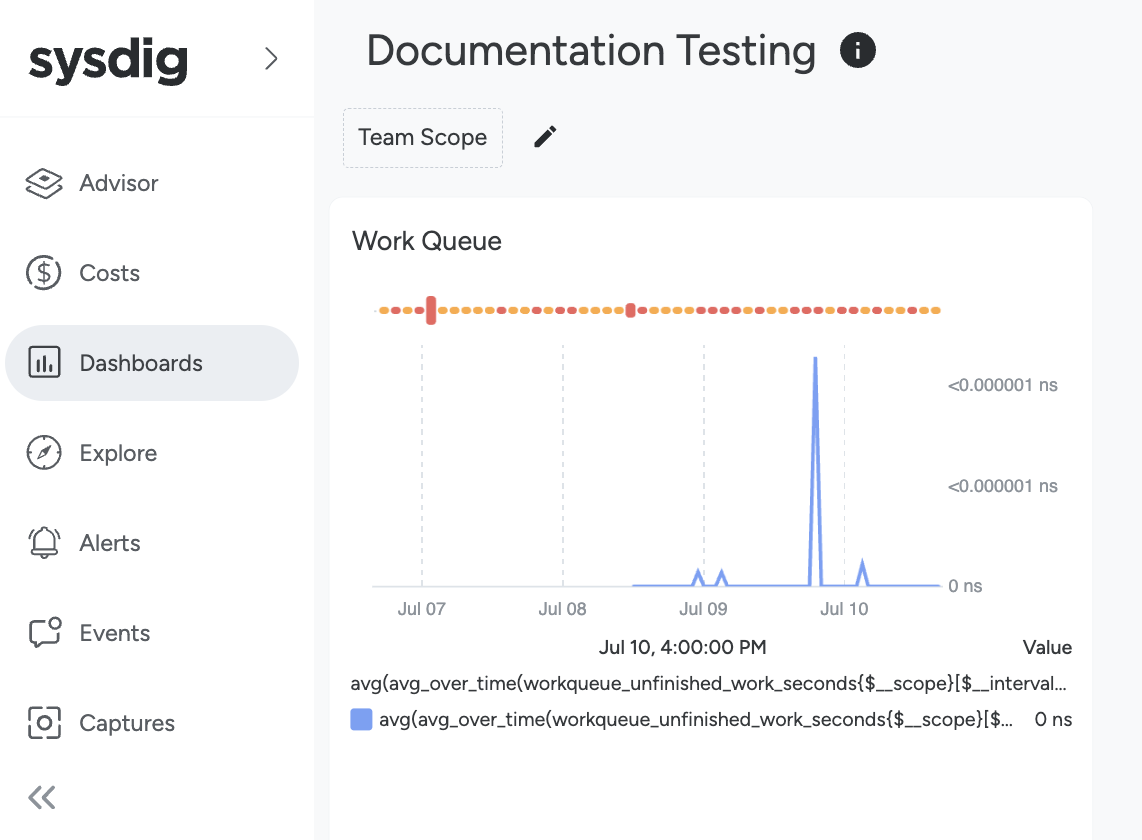
In this example, the scope is Team Scope.
By default, all dashboard panels abide by the scope of the overall dashboard. However, an individual panel scope can be configured for a different scope than the rest of the dashboard.
Alerts
You can define an alert scope when you create an alert, or you can edit the scope of an exiting alert.
By default, the scope will conform to your Team Scope. Select Team Scope to specify the scope further by adding more labels.
Teams
A team’s scope determines the highest level of data that team members have visibility for:
If a team’s scope is set to
Host, team members can see all host-level and container-level information.If a team’s scope is set to Container, team members can only see container-level information.
A team’s scope only applies to that team. Users that are members of multiple teams may have different visibility depending on which team is active.
For more information on teams and configuring team scope, refer to the Manage Teams and Roles documentation.
Segments
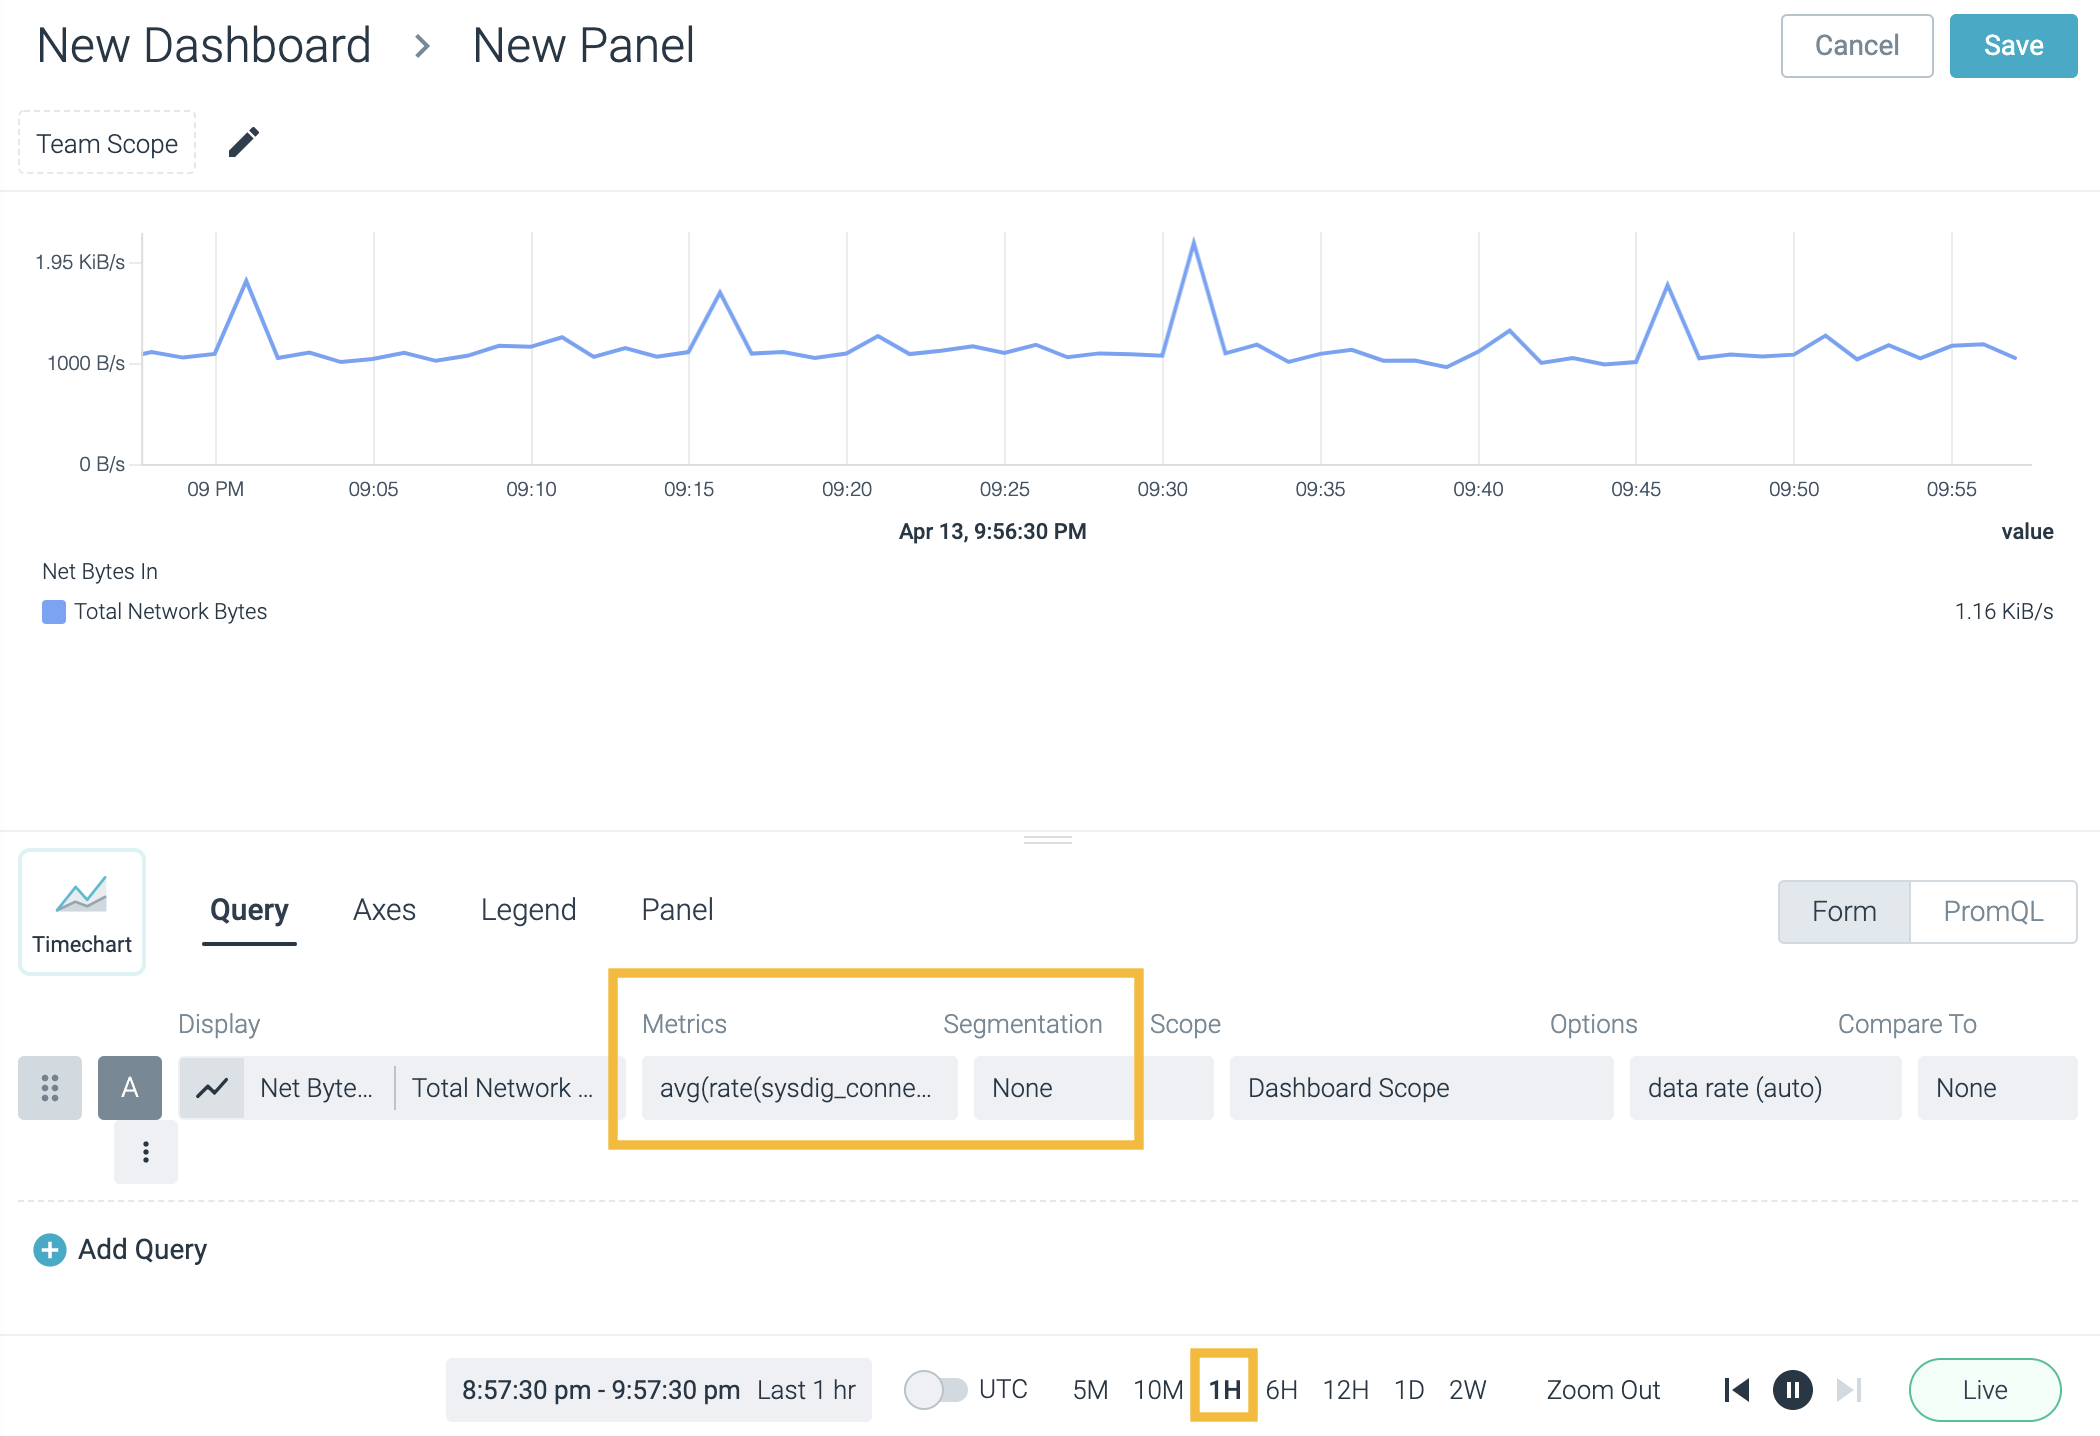
Aggregated data can be split into smaller sections by segmenting the data with labels. This allows for the creation of multi-series comparisons and multiple alerts. In the first image, the metric is not segmented:
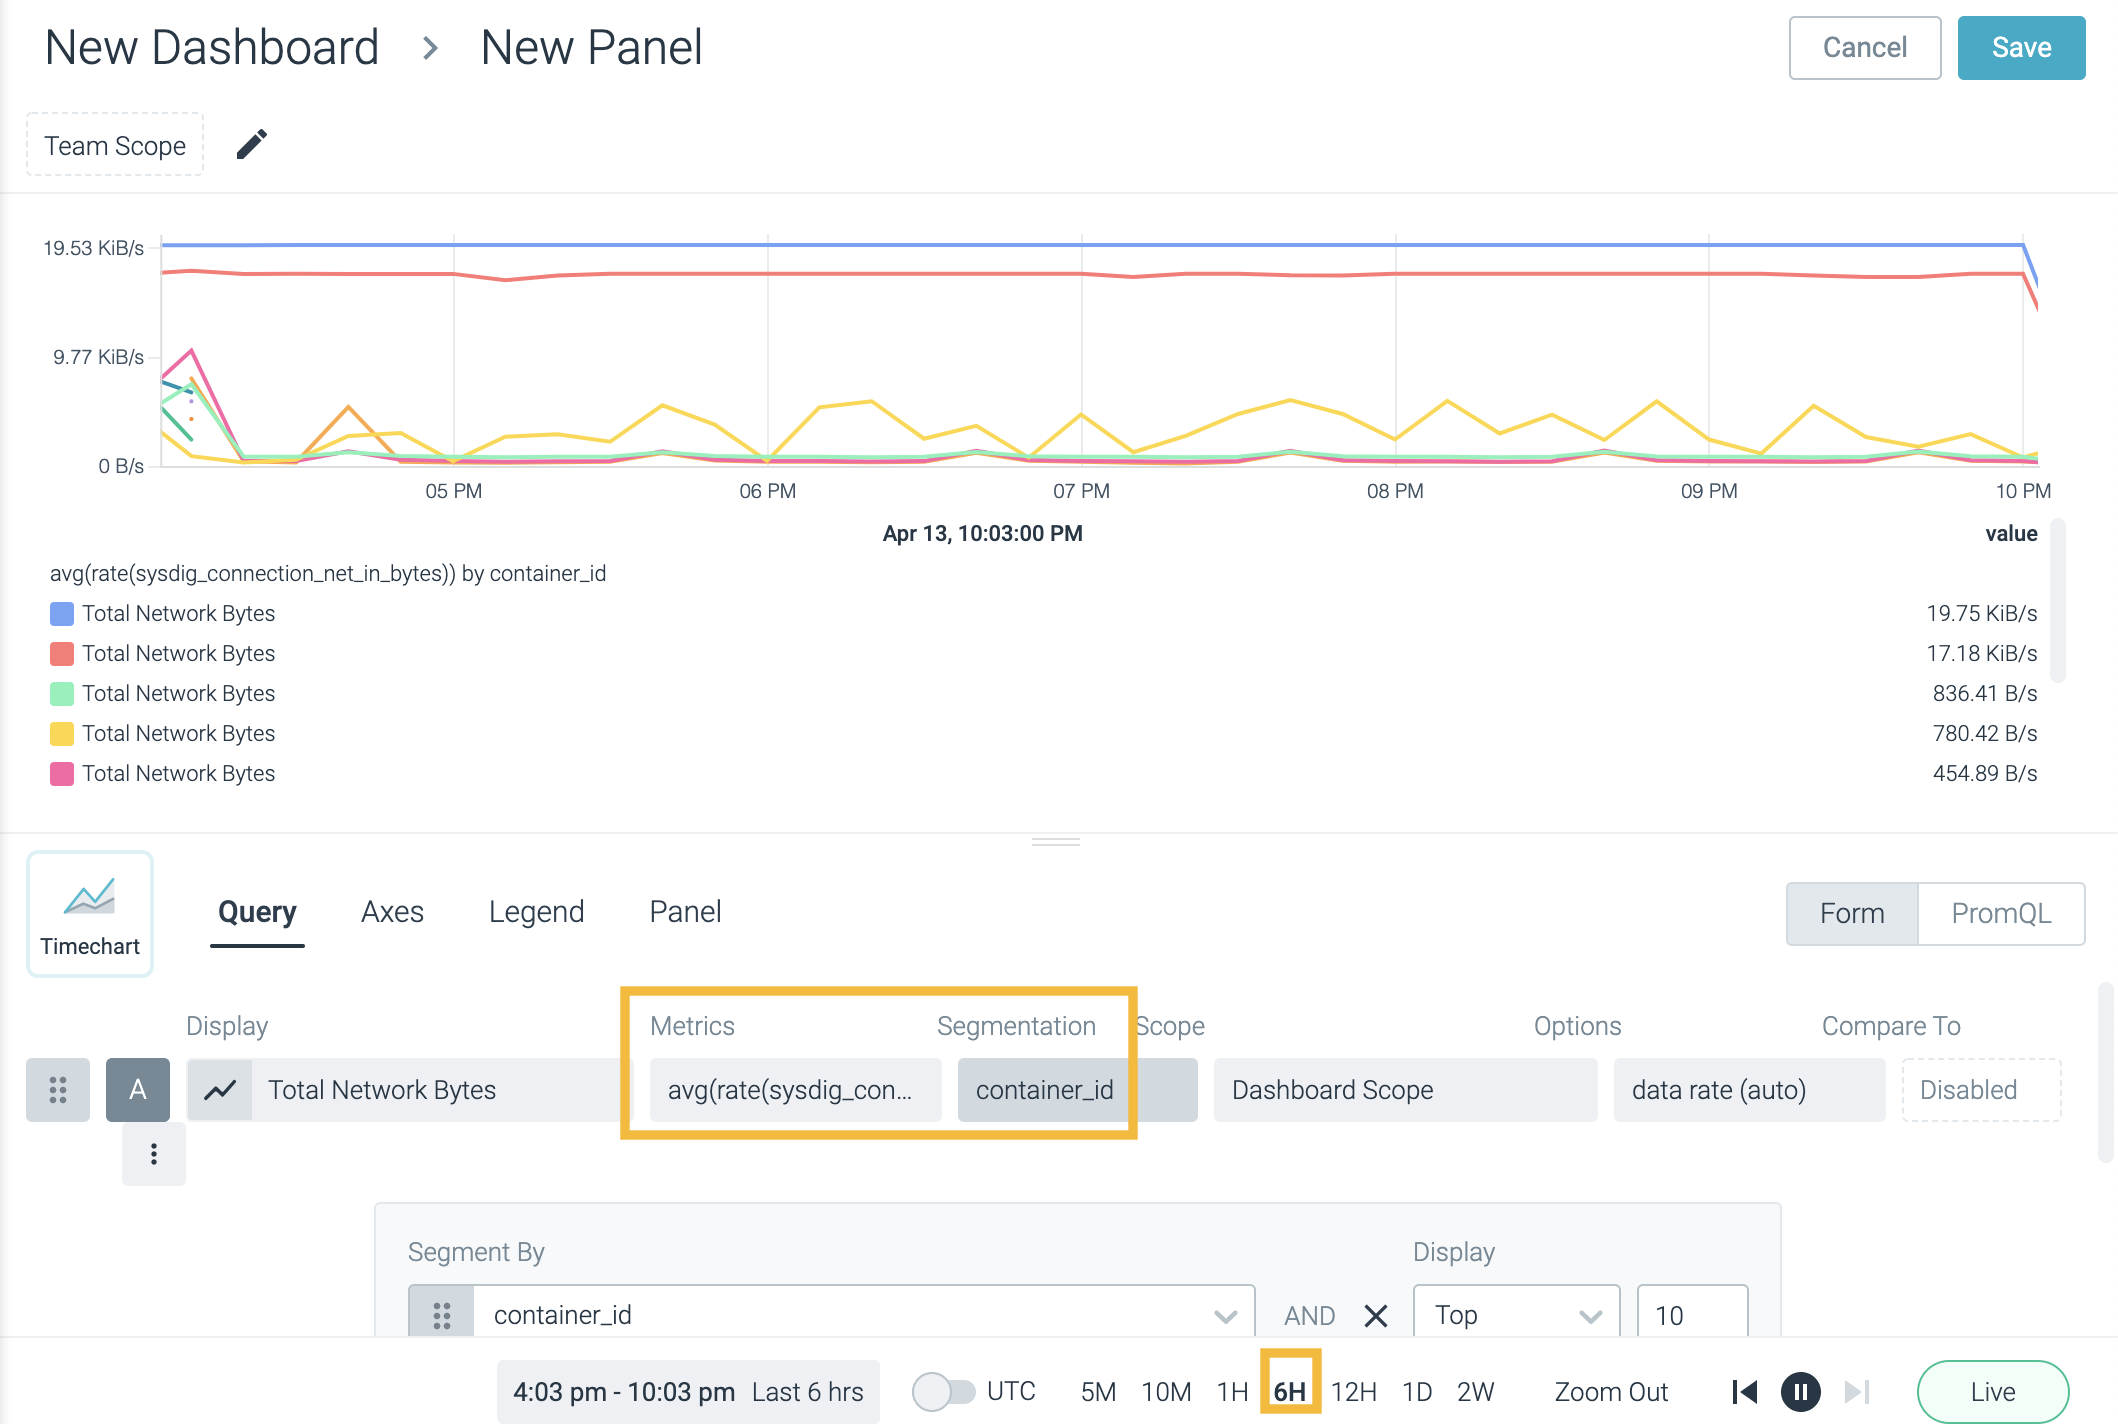
In the second image, the same metric has been segmented by container_id:
Line and Area panels can display any number of segments for any given metric. The example image below displays the sysdig_connection_net_in_bytes metric segmented by both container_id and host_hostname:
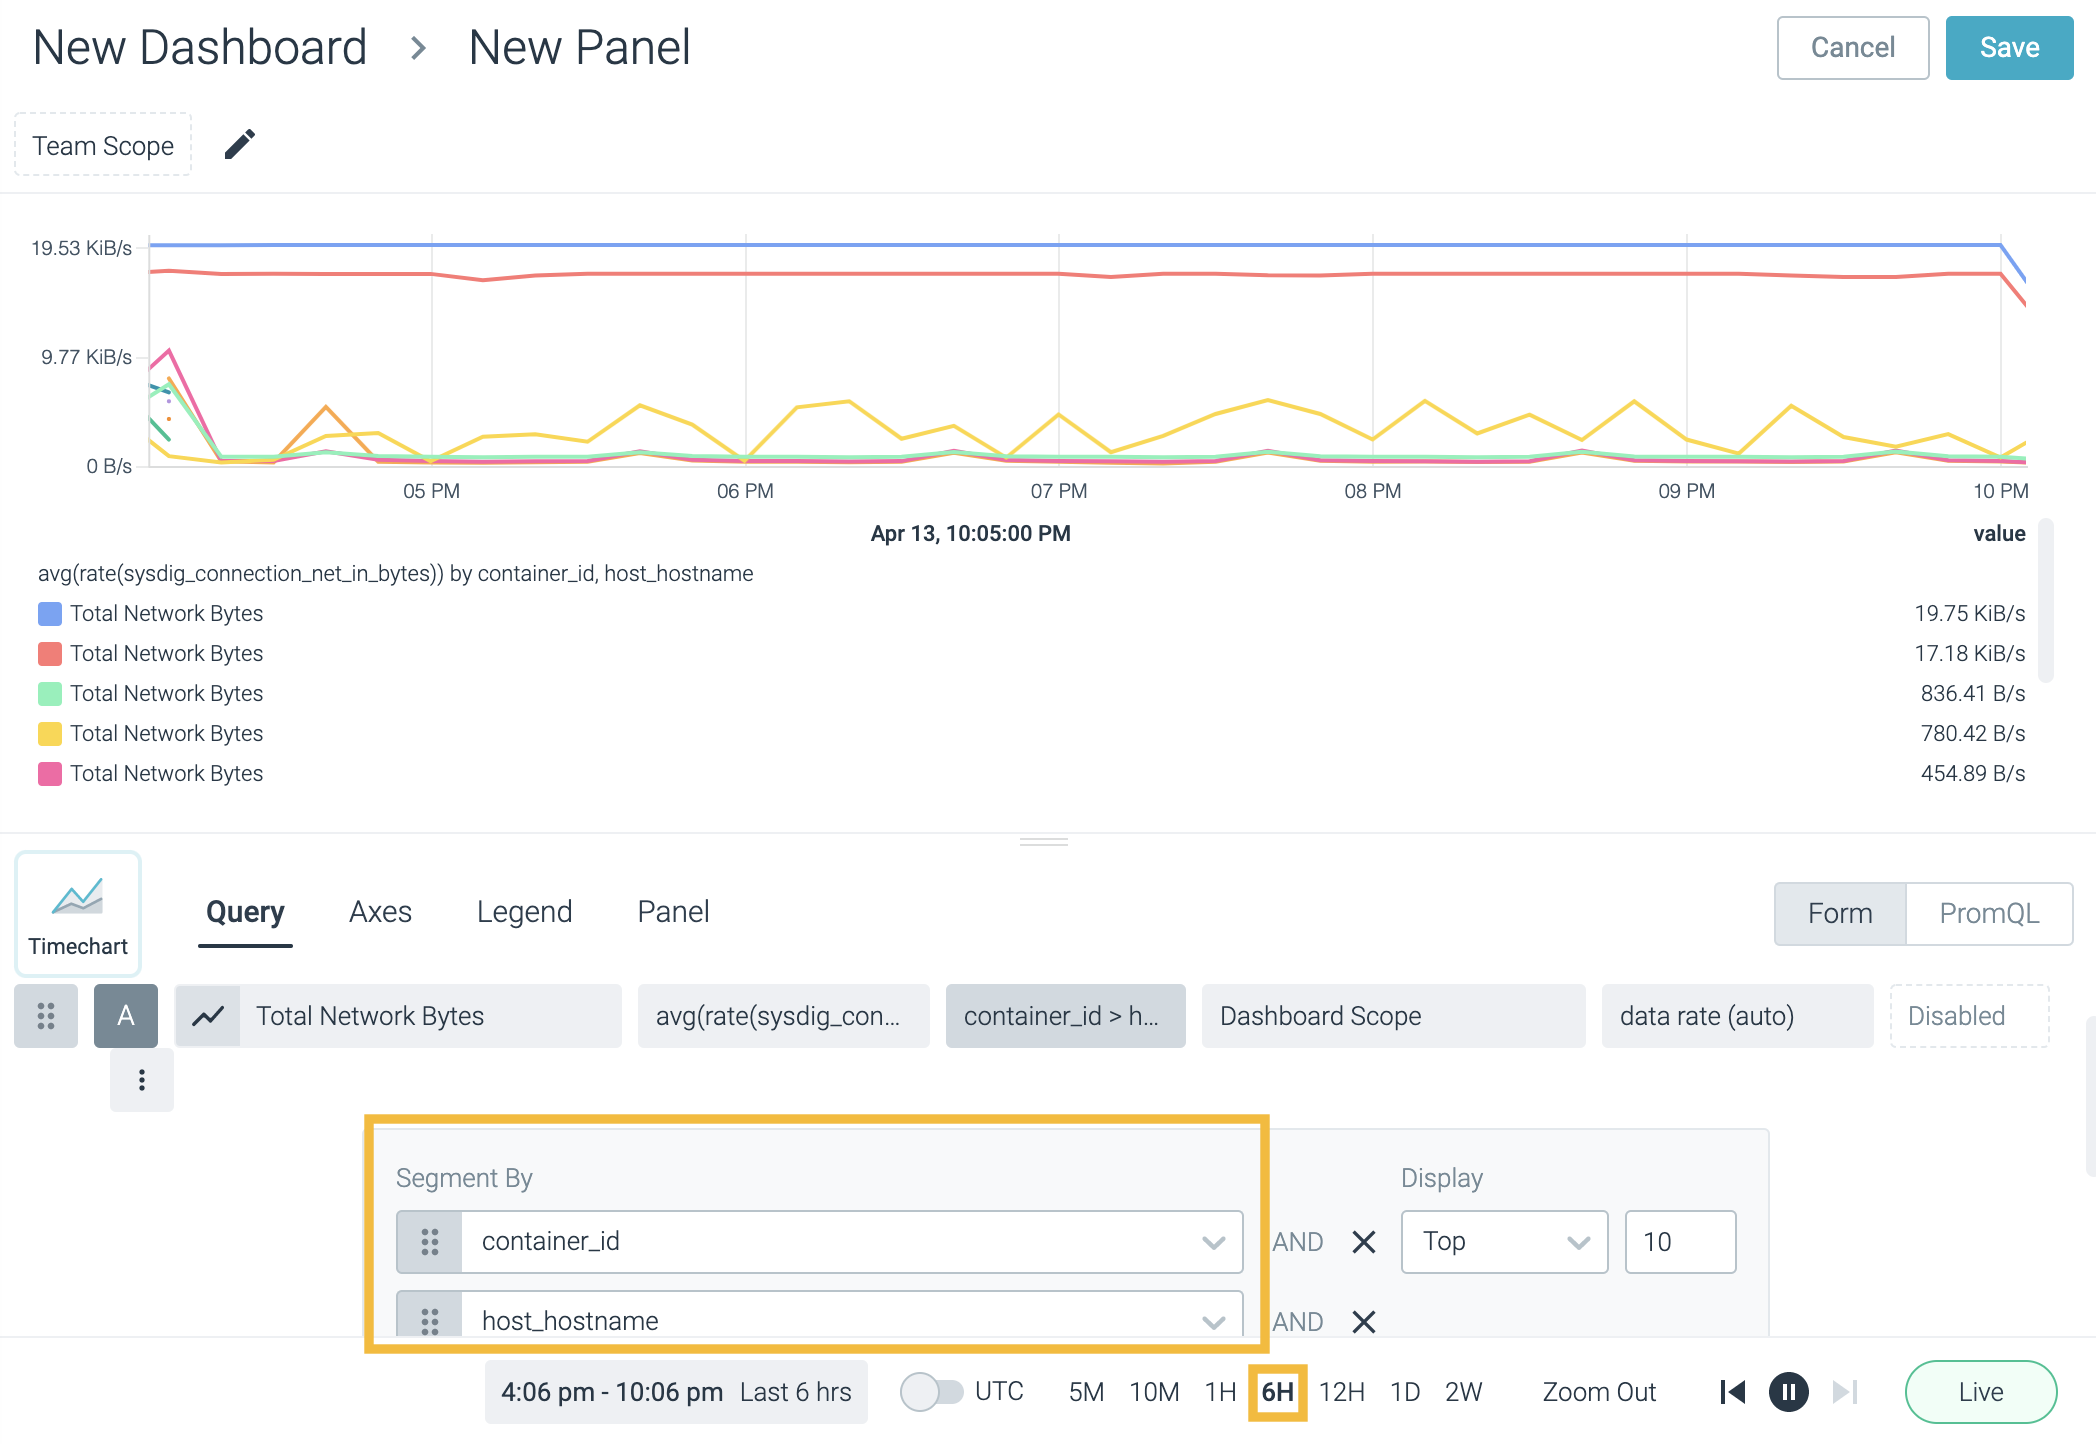
For more information regarding segmentation in dashboard panels, refer to the Configure Panels documentation. For more information regarding configuring alerts, refer to the Alerts documentation.
Cardinality
Cardinality refers to the number of unique time series associated with a given metric. As each combination of labels and label values yields a single time series, all such combinations are counted for a metric, and the number is represented on the Metrics Usage UI.
Consider calculating the total number of time series for the container_spec_cpu_period metric, which is represented in PromQL as follows:
count(container_spec_cpu_period{})
This query counts all the combinations for labels and label values associated with container_spec_cpu_period. For example:
- Time series 1:
container_spec_cpu_period {_sysdig_datasource="agent",job="k8s-cadvisor-default"} - Time series 2:
container_spec_cpu_period {_sysdig_datasource="agent",job="kubernetes-nodes-cadvisor"} - Time series 3:
container_spec_cpu_period {_sysdig_datasource="remote write",job="kubernetes-nodes-cadvisor"} - Time series 4:
container_spec_cpu_period {_sysdig_datasource="remote write",job="custom-prom-job"}
The Meaning of n/a
Sysdig Monitor imports data related to entities such as hosts, containers, processes, and so on, and reports them in tables or panels on the Explore and Dashboards UI, as well as in events, so across the UI you see varieties of data. The term n/a can appear anywhere on the UI where some form of data is displayed.
n/a is a term that indicates data that is not available or that it does not apply to a particular instance. In Sysdig parlance, the term signifies one or more entities defined by a particular label, such as hostname or Kubernetes service, for which the label is invalid. In other words, n/a collectively represents entities whose metadata is not relevant to aggregation and filtering techniques—Grouping, Scoping, and Segmenting. For instance, a list of Kubernetes services might display the list of all the services as well as n/a that includes all the containers without the metadata describing a Kubernetes service.
You might encounter n/a sporadically in Explore UI as well as in drill-down panels or dashboards, events, and likely elsewhere on the Sysdig Monitor UI when no relevant metadata is available for that particular display. How n/a should be treated depends on the nature of your deployment. The deployment will not be affected by the entities marked n/a.
The following are some of the cases that yield n/a on the UI:
Labels are partially available or not available. For example, a host has entities that are not associated with a monitored Kubernetes deployment, or a monitored host has an unmonitored Kubernetes deployment running.
Labels that do not apply to the grouping criteria or at the hierarchy level. For example:
Containers that are not managed by Kubernetes. The containers managed by Kubernetes are identified with their
container_namelabels.In certain groupings by DaemonSet, Deployments render N/A and vice versa. Not all containers belong to both DaemonSet and Deployment objects concurrently. Likewise, a Kubernetes ReplicaSet grouping with the
kubernetes_replicaset_namelabel will not show StatefulSets.In a
kubernetes_cluster_name > kubernetes_namespace_name > kubernetes_deployment_namegrouping, the entities without thekubernetes_cluster_namelabel yield n/a.
Entities are incorrectly labeled in the infrastructure.
Kubernetes features that are yet to be in sync with Sysdig Monitoring.
The format is not applicable to a particular record in the database.
Feedback
Was this page helpful?
Glad to hear it! Please tell us how we can improve.
Sorry to hear that. Please tell us how we can improve.
