Host
Below is the list of Host metrics.
Sysdig follows the Prometheus-compatible naming convention for both metrics and labels as opposed to the previous statsd-compatible, legacy Sysdig naming convention. This page shows metrics in the legacy Sysdig naming convention. See Metrics and Label Mapping for the mapping between Sysdig legacy and Prometheus naming conventions.
agent.id
| Metadata | Description |
|---|
| Metric Type | Gauge |
| Value Type | String |
| Segment By | Host |
| Default Time Aggregation | N/A |
| Available Time Aggregation Formats | N/A |
| Default Group Aggregation | N/A |
| Available Group Aggregation Formats | N/A |
agent.mode
For more information on agent modes, see Configure Agent
Modes.
| Metadata | Description |
|---|
| Metric Type | String |
| Value Type | String |
| Segment By | Host |
| Default Time Aggregation | concat |
| Available Time Aggregation Formats | concat, distinct, count |
| Default Group Aggregation | concat |
| Available Group Aggregation Formats | concat, distinct, count |
agent.version
| Metadata | Description |
|---|
| Metric Type | Gauge |
| Value Type | String |
| Segment By | Host |
| Default Time Aggregation | N/A |
| Available Time Aggregation Formats | N/A |
| Default Group Aggregation | N/A |
| Available Group Aggregation Formats | N/A |
cpu.core
| Metadata | Description |
|---|
| Metric Type | Gauge |
| Value Type | String |
| Segment By | Host |
| Default Time Aggregation | N/A |
| Available Time Aggregation Formats | N/A |
| Default Group Aggregation | N/A |
| Available Group Aggregation Formats | N/A |
host.container.mappings
| Metadata | Description |
|---|
| Metric Type | Gauge |
| Value Type | String |
| Segment By | Host |
| Default Time Aggregation | N/A |
| Available Time Aggregation Formats | N/A |
| Default Group Aggregation | N/A |
| Available Group Aggregation Formats | N/A |
host.count
| Metadata | Description |
|---|
| Metric Type | Gauge |
| Value Type | Integer |
| Segment By | Host, CloudProvider |
| Default Time Aggregation | Rate |
| Available Time Aggregation Formats | Avg, Rate, Sum, Min, Max |
| Default Group Aggregation | Sum |
| Available Group Aggregation Formats | Avg, Sum, Min, Max |
host.domain
| Metadata | Description |
|---|
| Metric Type | Gauge |
| Value Type | String |
| Segment By | Host |
| Default Time Aggregation | N/A |
| Available Time Aggregation Formats | N/A |
| Default Group Aggregation | N/A |
| Available Group Aggregation Formats | N/A |
host.hostName
| Metadata | Description |
|---|
| Metric Type | Gauge |
| Value Type | String |
| Segment By | Host |
| Default Time Aggregation | N/A |
| Available Time Aggregation Formats | N/A |
| Default Group Aggregation | N/A |
| Available Group Aggregation Formats | N/A |
host.ip.all
| Metadata | Description |
|---|
| Metric Type | Gauge |
| Value Type | String |
| Segment By | Host |
| Default Time Aggregation | N/A |
| Available Time Aggregation Formats | N/A |
| Default Group Aggregation | N/A |
| Available Group Aggregation Formats | N/A |
host.ip.private
| Metadata | Description |
|---|
| Metric Type | Gauge |
| Value Type | String |
| Segment By | Host |
| Default Time Aggregation | N/A |
| Available Time Aggregation Formats | N/A |
| Default Group Aggregation | N/A |
| Available Group Aggregation Formats | N/A |
host.ip.public
| Metadata | Description |
|---|
| Metric Type | Gauge |
| Value Type | String |
| Segment By | Host |
| Default Time Aggregation | N/A |
| Available Time Aggregation Formats | N/A |
| Default Group Aggregation | N/A |
| Available Group Aggregation Formats | N/A |
host.isClientServer
| Metadata | Description |
|---|
| Metric Type | Gauge |
| Value Type | String |
| Segment By | Host |
| Default Time Aggregation | N/A |
| Available Time Aggregation Formats | N/A |
| Default Group Aggregation | N/A |
| Available Group Aggregation Formats | N/A |
host.isInstrumented
| Metadata | Description |
|---|
| Metric Type | Gauge |
| Value Type | String |
| Segment By | Host |
| Default Time Aggregation | N/A |
| Available Time Aggregation Formats | N/A |
| Default Group Aggregation | N/A |
| Available Group Aggregation Formats | N/A |
host.isInternal
| Metadata | Description |
|---|
| Metric Type | Gauge |
| Value Type | String |
| Segment By | Host |
| Default Time Aggregation | N/A |
| Available Time Aggregation Formats | N/A |
| Default Group Aggregation | N/A |
| Available Group Aggregation Formats | N/A |
host.mac
| Metadata | Description |
|---|
| Metric Type | Gauge |
| Value Type | String |
| Segment By | Host |
| Default Time Aggregation | N/A |
| Available Time Aggregation Formats | N/A |
| Default Group Aggregation | N/A |
| Available Group Aggregation Formats | N/A |
host.procList.main
| Metadata | Description |
|---|
| Metric Type | Gauge |
| Value Type | String |
| Segment By | Host |
| Default Time Aggregation | N/A |
| Available Time Aggregation Formats | N/A |
| Default Group Aggregation | N/A |
| Available Group Aggregation Formats | N/A |
host.uname
host.uname provides the following system information:
kernel name
kernel release number
kernel version
machine hardware name
Agents send this metric along with a number of labels that map with
the uname information. host.uname is supported on agent versions
10.1 and above.
Metrics Details
| Metadata | Description |
|---|
| Metric Type | Gauge |
| Value Type | Integer |
| Segment By | See Segmentation Details. |
| Default Time Aggregation | Average |
| Available Time Aggregation | Average, Rate, Sum, Min, Max, Rate of Change |
| Default Group Aggregation | Average |
| Available Group Rollup | Average, Sum, Min, Max |
Segmentation Details
The labels are given below:
| Label | Description | Mapping to the uname tooling | Example |
|---|
host.uname.kernel.name | The kernel name | uname -s | Linux |
host.uname.kernel.release | The kernel release | uname -r | 5.4.0-31-generic |
host.uname.kernel.version | The kernel version | uname -v | #35-Ubuntu SMP Thu May 7 20:20:34 UTC 2020 |
host.machine | The hardware name of the machine | uname -m | x86_64 |
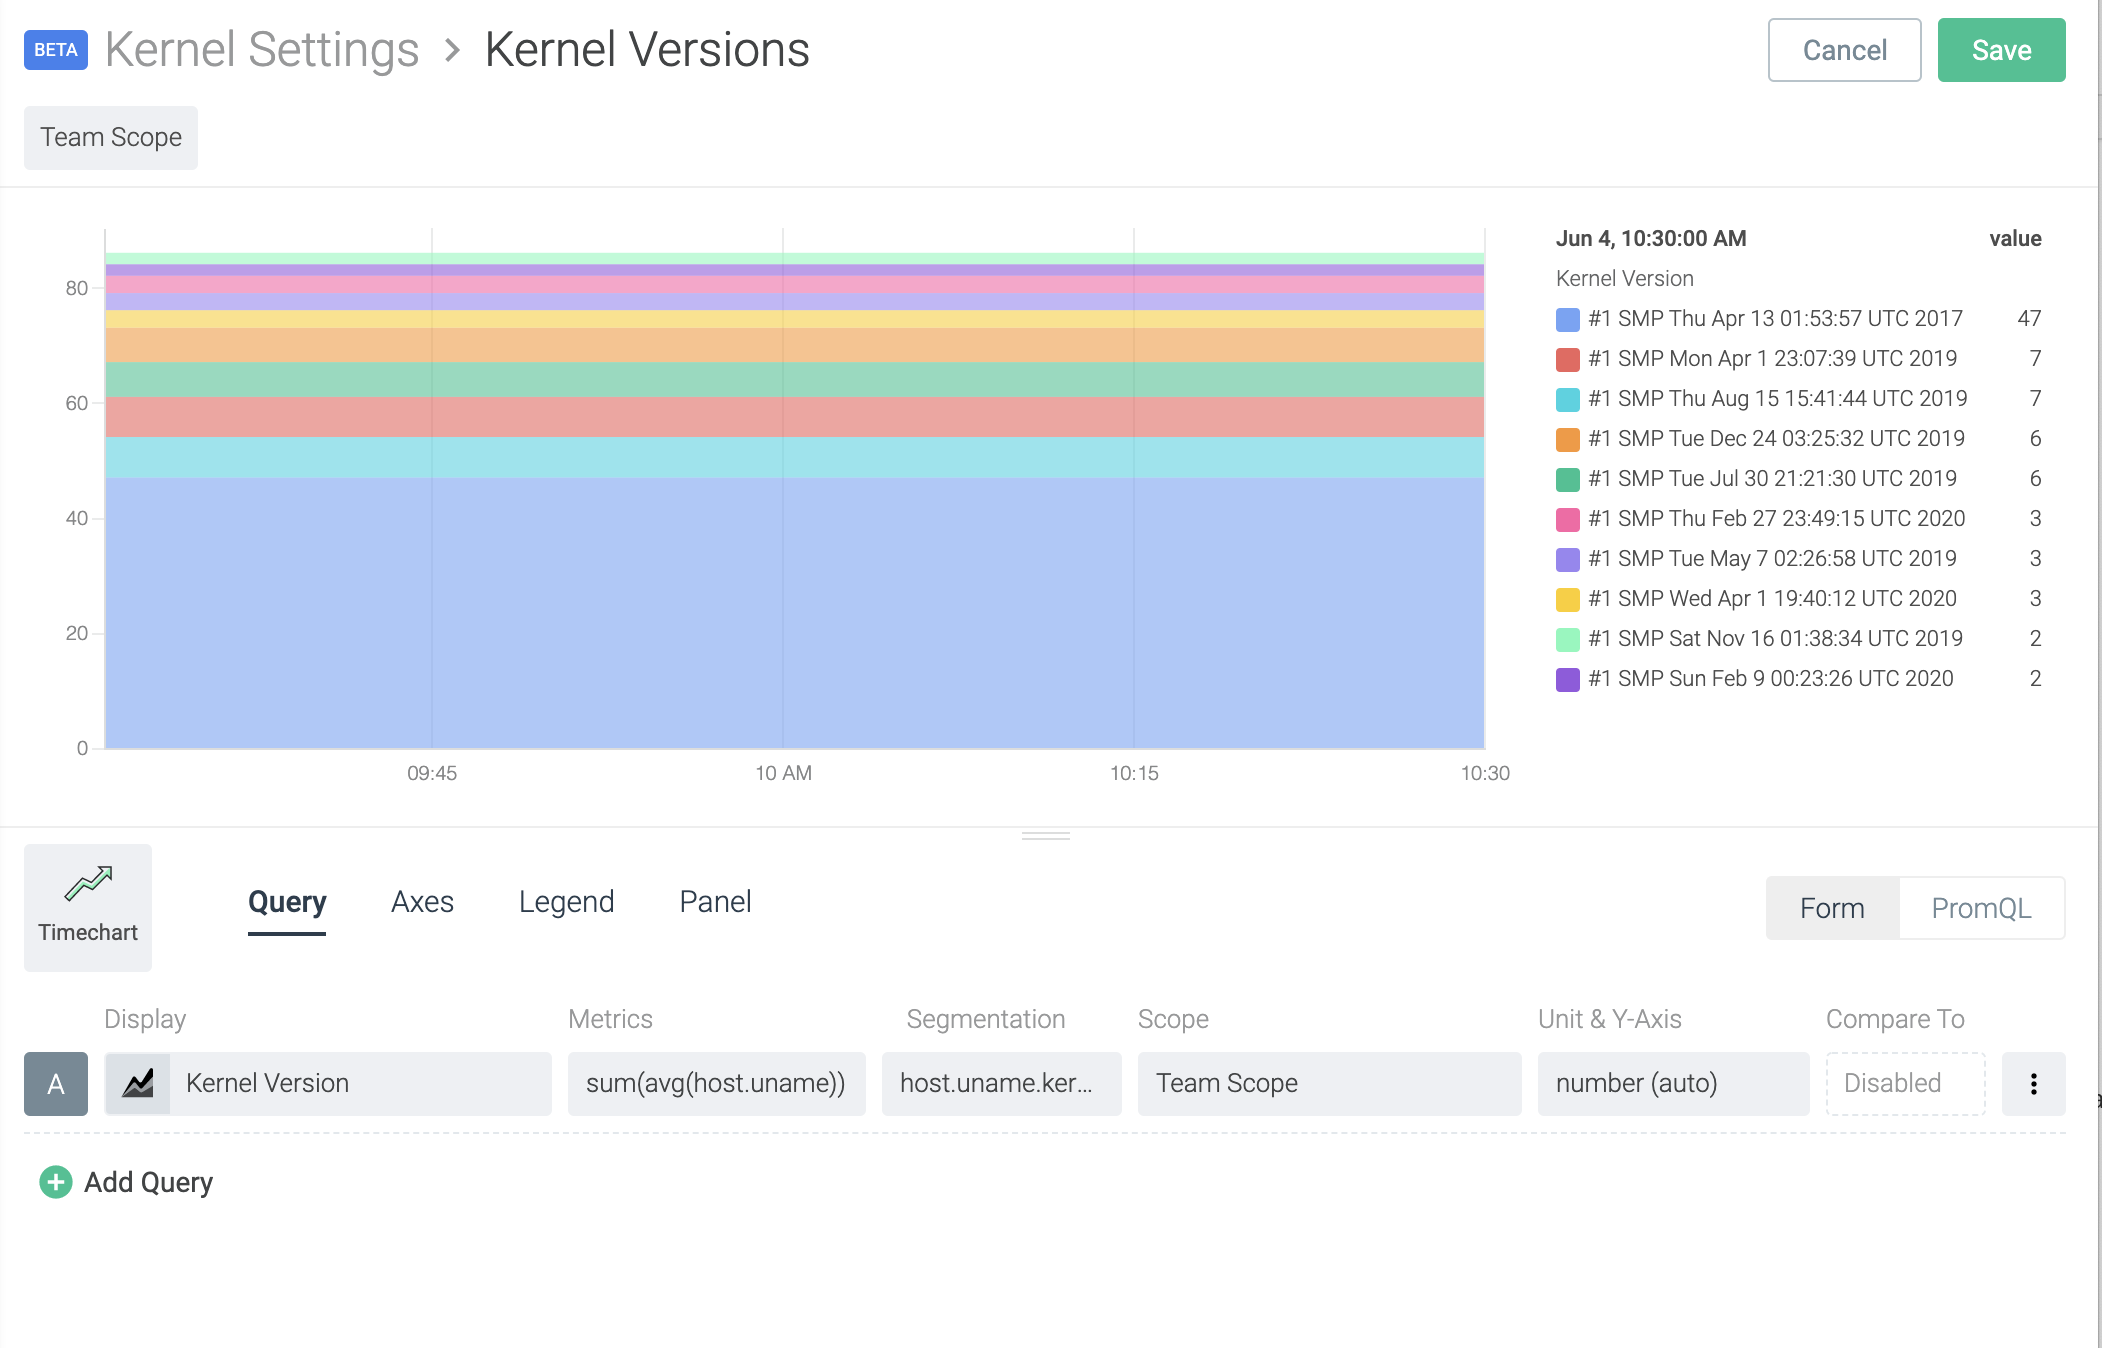
Example: Kernel Versions in the Infrastructure
The image depicts host.uname being segmented by
host.uname.kernel.version. The resulting dashboard gives the
distribution of kernel versions in the infrastructure.
Count Limits StasD Metrics
The count limits metrics report the upper limit of the number of metrics
of the same type. The values the metrics report can be changed by
modifying the dragent.yaml file.
| Metric Name | Configuration Parameter in the dragent.yaml file | Default Value |
|---|
metricCount.limit.appCheck | app_checks_limit | 500 |
metricCount.limit.statsd | statsd.limit | 100 |
metricCount.limit.jmx | jmx.limit | 500 |
metricCount.limit.prometheus | prometheus.max+metrics | 3000 |
metricCount.appCheck
| Metadata | Description |
|---|
| Metric Type | Gauge |
| Value Type | String |
| Segment By | Host |
| Default Time Aggregation | N/A |
| Available Time Aggregation Formats | N/A |
| Default Group Aggregation | N/A |
| Available Group Aggregation Formats | N/A |
metricCount.jmx
| Metadata | Description |
|---|
| Metric Type | Gauge |
| Value Type | String |
| Segment By | Host |
| Default Time Aggregation | N/A |
| Available Time Aggregation Formats | N/A |
| Default Group Aggregation | N/A |
| Available Group Aggregation Formats | N/A |
metricCount.statsd
| Metadata | Description |
|---|
| Metric Type | Gauge |
| Value Type | String |
| Segment By | Host |
| Default Time Aggregation | N/A |
| Available Time Aggregation Formats | N/A |
| Default Group Aggregation | N/A |
| Available Group Aggregation Formats | N/A |
metricCount.prometheus
| Metadata | Description |
|---|
| Metric Type | Gauge |
| Value Type | String |
| Segment By | Host |
| Default Time Aggregation | N/A |
| Available Time Aggregation Formats | N/A |
| Default Group Aggregation | N/A |
| Available Group Aggregation Formats | N/A |