Query Inspector
Feature Availability
This feature is currently available only to SaaS users.Using Query Inspector
Query Inspector currently supports only PromQL-based panels.
| Step | Preview |
|---|---|
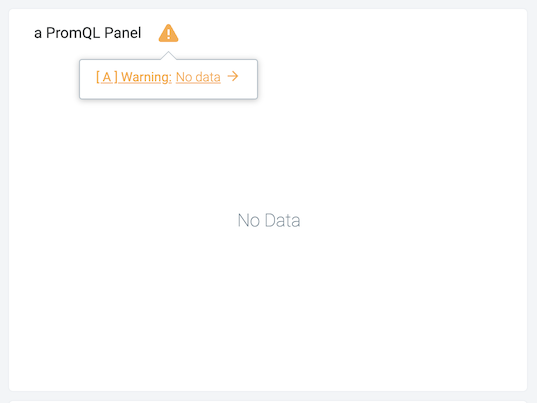
| In a PromQL Panel, click the link given next to a No Data message. Alternatively, you can acess it in a similar fashion when editing or viewing dashboards panels, and using Metrics Explorer. | |
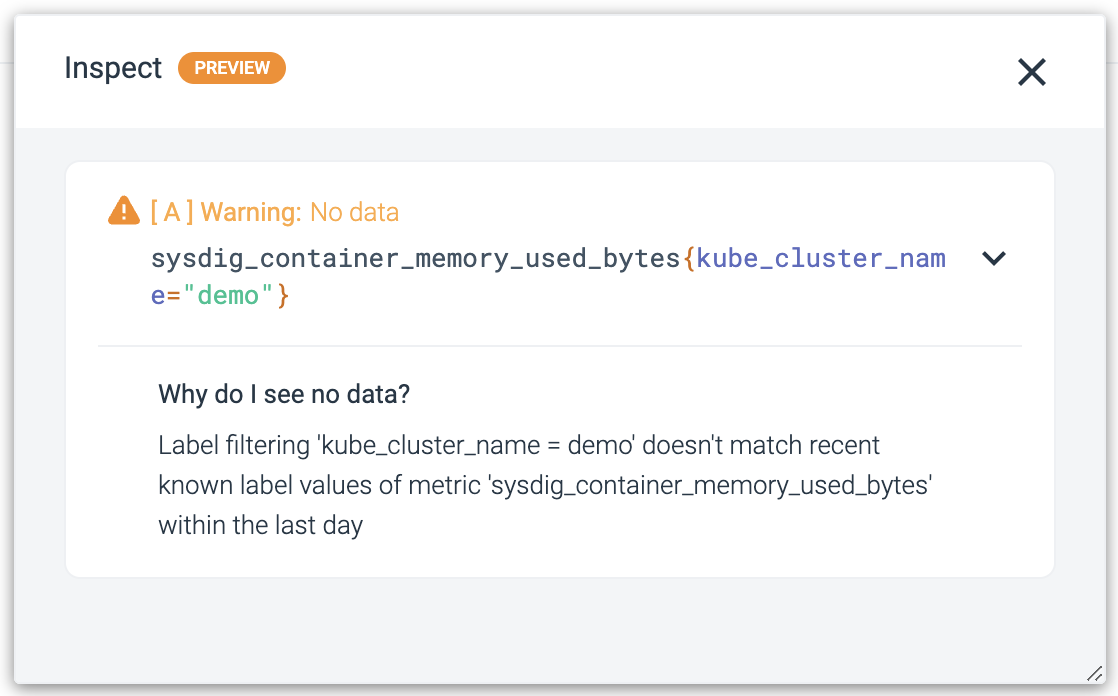
| The Inspect floating window opens. |
Underlying Causes of No Data
Inspector checks for underlying No Data causes in the below order, which means diagnostics are run sequentially.
As you leverage the Query Inspector to gain insights on No Data situations, you can use this page to obtain a better understanding of the underlying root causes.
Unable to run Diagnostics due to missing metric name
This scenario occurs when a PromQL query does not contain any metric name, for example:
- Scalars such as
1024 - Functions such as
hour()
Metric doesn’t exist or was never reported
Check the metric name being used to spot potential spelling mistakes. PromQL Query Explorer, Metrics Explorer, and Dashboards come with a built-in auto-complete for metric names, which can be used to assist in this task. Alternatively, see the information in the Metrics and Labels in Prometheus Format docs.
If a metric is being provided by an integration, check they have been configured as required. This information is outlined in the Monitoring Integration docs.
If the metric is being scrapped by Prometheus and sent to Monitor via Prometheus Remote Write, check your Prometheus configuration.
Metric has not been reported recently within the current selected team scope
This message is raised by Inspector to signal the metric exists, but not within the currently selected team scope. When you encounter this error, you might want to validate whether you are using the correct Team and consider switching to the appropriate one as outlined in the Switching Teams in the UI docs.
Metric last reported data on [date]
This message is raised by Inspector when you are using a time window where the selected metric isn’t reporting any time series. This means its source likely stopped emitting the metric.
Causes for this issue vary, but you are invited to perform the same check as mentioned in Metric doesn’t exist or was never reported.
Additionally, you can leverage our Events page to check for relevant events close to the last reported date as outlined in the Filter and Search Events docs. This allows you to identify what caused the metric to stop being emitted by the source.
Label filtering doesn’t match recent known label values of metric within the last day
You can check the label filtering doesn’t contain any typos such as {enviroment="production}" or {environment="poduction"}. PromQL Query Explorer, Metrics Explorer, and Dashboards come with a built-in auto-complete for label names, which can be used to assist in this task.
Additionally, you might be looking for an entity (ie. container, node, host) that no longer exists.
Query is not returning data
This catch-all message is used when Inspector is not able to determine the underlying reason a query yields No Data.
These are some of the additional reasons you may be seeing No Data:
- using operators with metrics that do not have matching sets of labels (see Prometheus docs about vector matching)
- using a time range, in a range vector selector (
my_metric[1s]), for which there are no data points- this could happen also when using an instant query Form panel(Number, Toplist, Table) with a sparse metric (see Use of Latest Displayed Value with Sparse Metric)

