Configure Default Integrations
It’s only for PromScrape V2.
Each Monitoring Integration holds a specific job that scrapes its metrics and sends them to Sysdig Monitor. To optimize metrics scraping for building dashboards and alerts in Sysdig Monitor, Sysdig offers default jobs for these integrations. Periodically, the Sysdig agent connects with Sysdig Monitor retrieves the default jobs, and makes the Monitoring Integrations available for use. See the list of the available integrations and corresponding jobs.
You can find all the jobs in the /opt/draios/etc/promscrape.yaml file in the sysdig-agent container in your cluster.
Two types of integrations are found:
- Enabled by default: Upon installing the Sysdig Agent, the integration starts sending metrics to the Sysdig backend.
- Out of the box: An integration that requires no exporter or extra configuration to retrieve metrics from the application. The application is already orchestrated.
Supported Monitoring Integrations
| Integration | Out of the Box | Enabled by default | Job name in config file |
|---|---|---|---|
| Apache | ✔ | apache-exporter-default, apache-grok-default | |
| Calico | ✔ | calico-node-default, calico-controller-default | |
| Cassandra | ✔ | cassandra-default | |
| Ceph | ✔ | ✔ | ceph-default |
| Consul | ✔ | ✔ | consul-server-default, consul-envoy-default |
| Elasticsearch | ✔ | elasticsearch-default | |
| Fluentd | ✔ | ✔ | fluentd-default, openshift-fluentd-default |
| HAProxy Ingress | ✔ | ✔ | haproxy-default |
| HAProxy Ingress OpenShift | ✔ | ✔ | haproxy-router |
| Harbor | ✔ | ✔ | harbor-exporter-default, harbor-core-default, harbor-registry-default, harbor-jobservice-default |
| IBM Kubernetes API Server | ✔ | iks-apiservers-default | |
| Istio | ✔ | ✔ | istiod |
| Kubernetes API server | ✔ | kubernetes-apiservers-default | |
| K8s cAdvisor | ✔ | ✔ | k8s-cadvisor-default |
| K8s cAdvisor full | ✔ | k8s-cadvisor-full | |
| Kubernetes controller manager | ✔ | ✔ | kube-controller-manager-default |
| Kubernetes CoreDNS | ✔ | ✔ | kube-dns-default |
| Kubernetes etcd | ✔ | ✔ | etcd-default, etcd-legacy-default |
| Kubernetes kubelet | ✔ | k8s-kubelet-default | |
| Kubernetes kube-proxy | ✔ | kubernetes-kube-proxy-default | |
| Kubernetes PVC | ✔ | k8s-pvc-default | |
| Kubernetes Scheduler | ✔ | ✔ | kube-scheduler-default |
| Kubernetes storage | ✔ | k8s-storage-default | |
| Kafka | ✔ | kafka-exporter-default, kafka-jmx-default | |
| KEDA | ✔ | ✔ | keda-default |
| Knative | ✔ | ✔ | knative-operator-default, knative-serving-controller-default, knative-serving-autoscaler-default, knative-serving-activator-default, knative-serving-webhook-default, knative-eventing-broker-filter-default, knative-eventing-broker-ingress-default, knative-eventing-controller-default, knative-eventing-imc-controller-default, knative-eventing-imc-dispatcher-default, knative-eventing-apiserver-source-default |
| Memcached | ✔ | memcached-default | |
| MongoDB | ✔ | mongodb-default | |
| MySQL | ✔ | mysql-default | |
| NGINX | ✔ | nginx-default | |
| NGINX Ingress | ✔ | ✔ | nginx-ingress-default |
| NTP | ✔ | ntp-default | |
| OPA | ✔ | ✔ | opa-default |
| OpenShift API-Server | ✔ | openshift-apiserver-default | |
| OpenShift Controller Manager | ✔ | ✔ | openshift-controller-manager-default |
| OpenShift CoreDNS | ✔ | ✔ | openshift-dns-default |
| OpenShift Etcd | ✔ | openshift-etcd-default | |
| OpenShift Scheduler | ✔ | ✔ | openshift-scheduler-default |
| OpenShift State Metrics | ✔ | ✔ | openshift-state-metrics |
| OracleDB | ✔ | oracledb-exporter-default | |
| PHP-FPM | ✔ | php-fpm-default | |
| Portworx | ✔ | ✔ | portworx-default, portworx-openshift-default |
| PostgreSQL | ✔ | postgres-default | |
| Prometheus Default Job | ✔ | ✔ | k8s-pods |
| RabbitMQ | ✔ | ✔ | rabbitmq-default |
| Rancher RKE API Server | ✔ | rancher-rke-api-server-default | |
| Rancher RKE Controller Manager | ✔ | rancher-rke-controller-manager-default | |
| Rancher RKE CoreDNS | ✔ | rancher-rke-coredns-default | |
| Rancher RKE Kube Proxy | ✔ | rancher-rke-kube-proxy-default | |
| Rancher RKE Scheduler | ✔ | rancher-rke-scheduler-default | |
| Rancher RKE2 API Server | ✔ | rancher-rke2-api-server-default | |
| Rancher RKE2 Controller Manager | ✔ | rancher-rke2-controller-manager-default | |
| Rancher RKE2 CoreDNS | ✔ | rancher-rke2-coredns-default | |
| Rancher RKE2 Etcd | ✔ | rancher-rke2-etcd-default | |
| Rancher RKE2 Kube Proxy | ✔ | rancher-rke2-kube-proxy-default | |
| Rancher RKE2 Scheduler | ✔ | rancher-rke2-scheduler-default | |
| Redis | ✔ | redis-default | |
| Redis Enterprise | ✔ | ✔ | redis-enterprise-default |
| Sysdig Admission Controller | ✔ | ✔ | sysdig-admission-controller-default |
Enable and Disable Integrations
Some integrations are disabled by default due to the potential high cardinality of their metrics. To enable or disable integrations, follow the below steps:
| Steps | Preview |
|---|---|
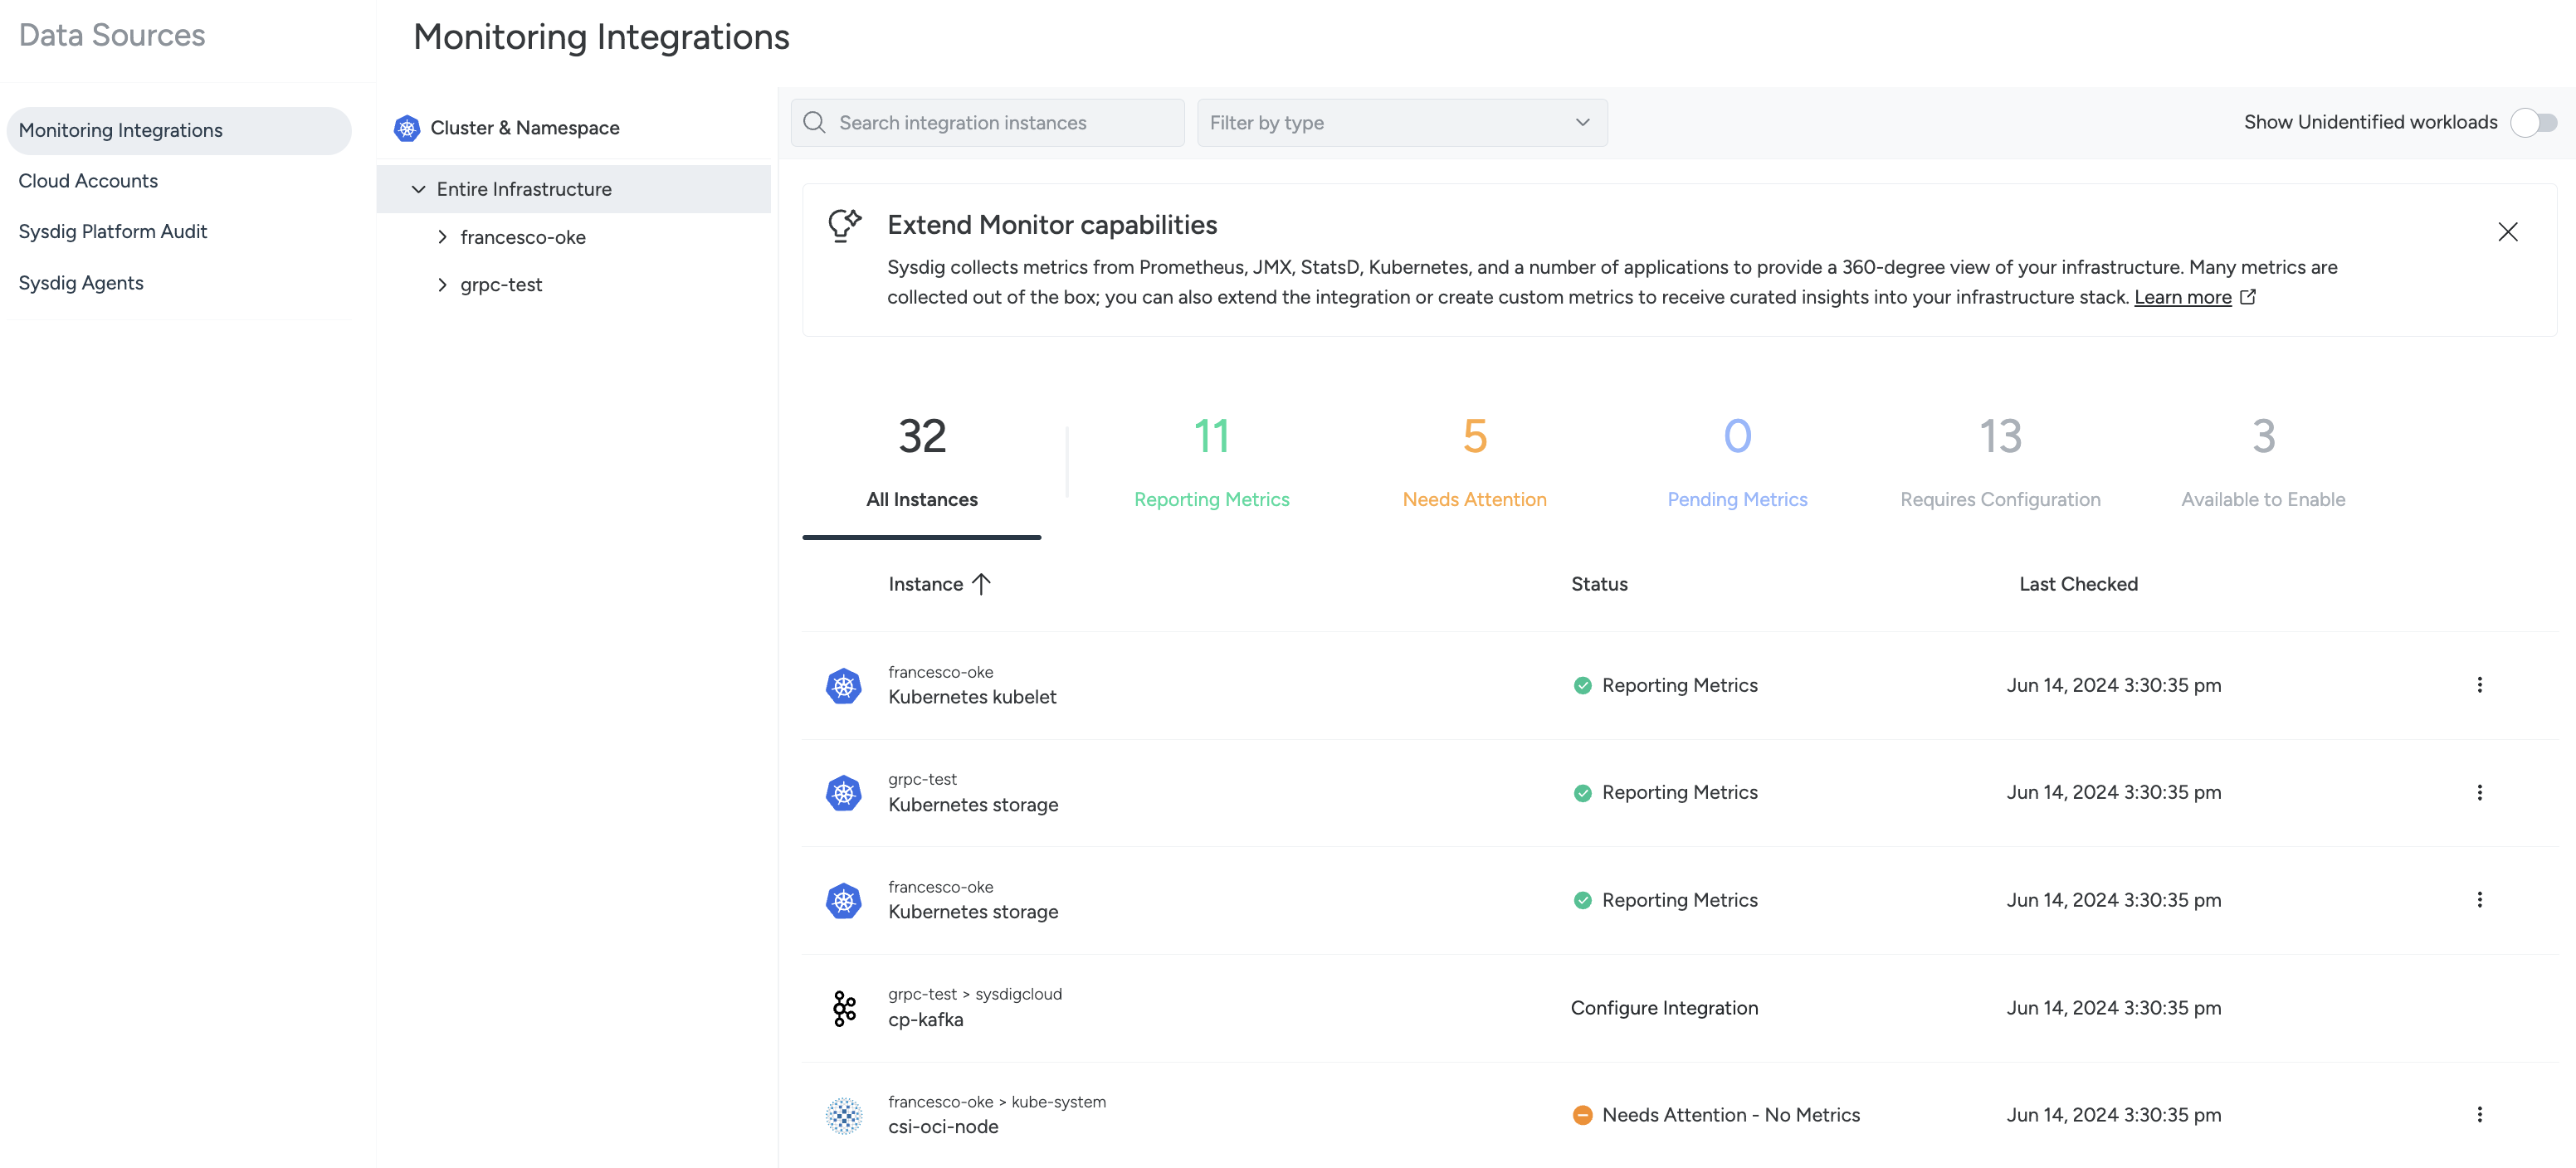
| Navigate to the Monitoring Integrations page (Integrations > Monitoring Integrations). |
|
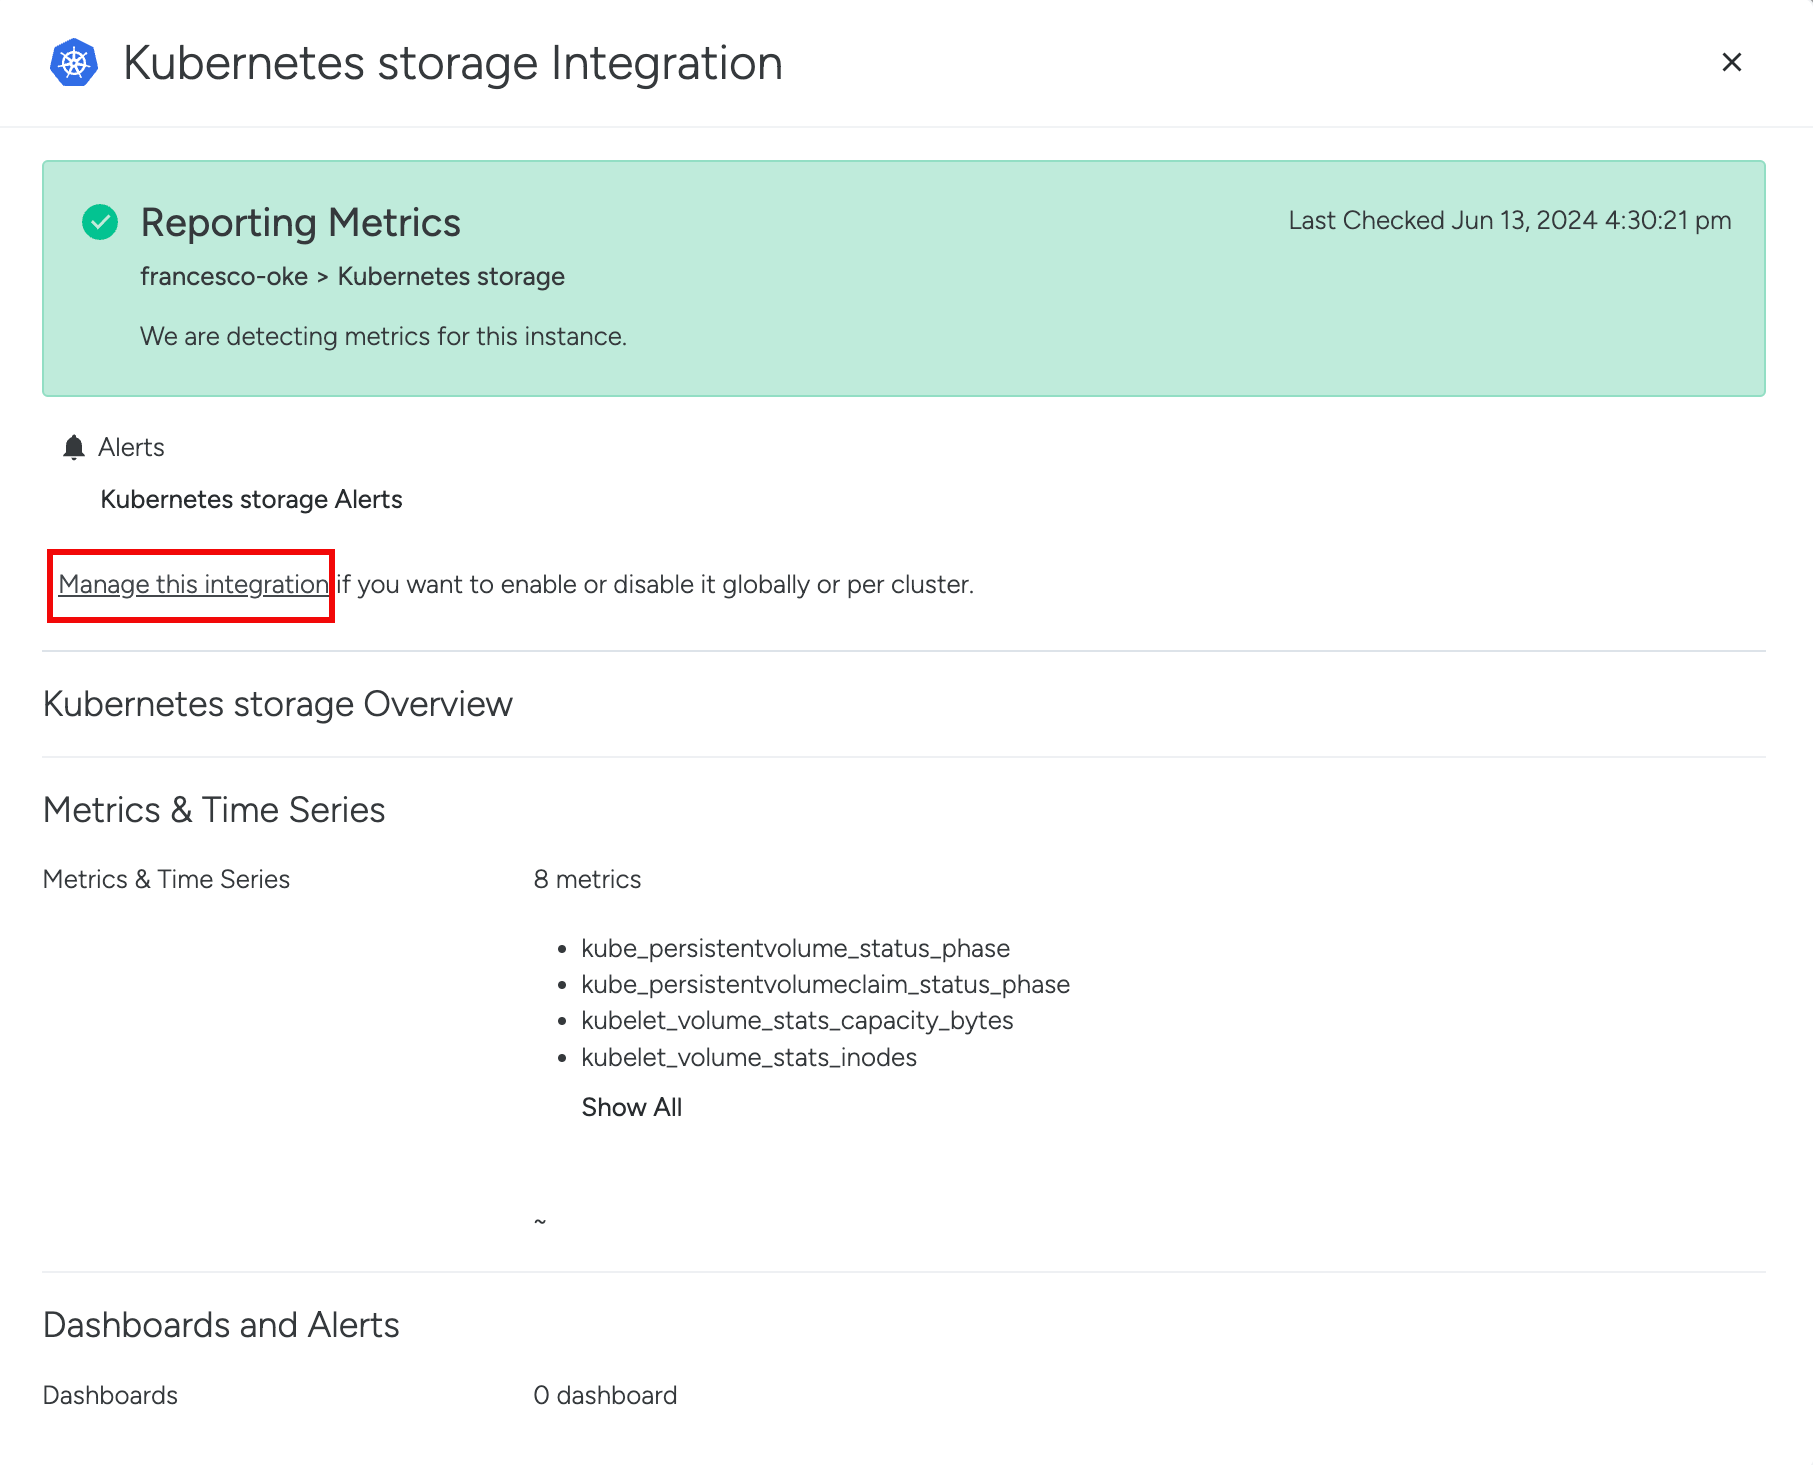
| Select any integration (eg. Kubernetes API server), and click on Manage this integration. |
|
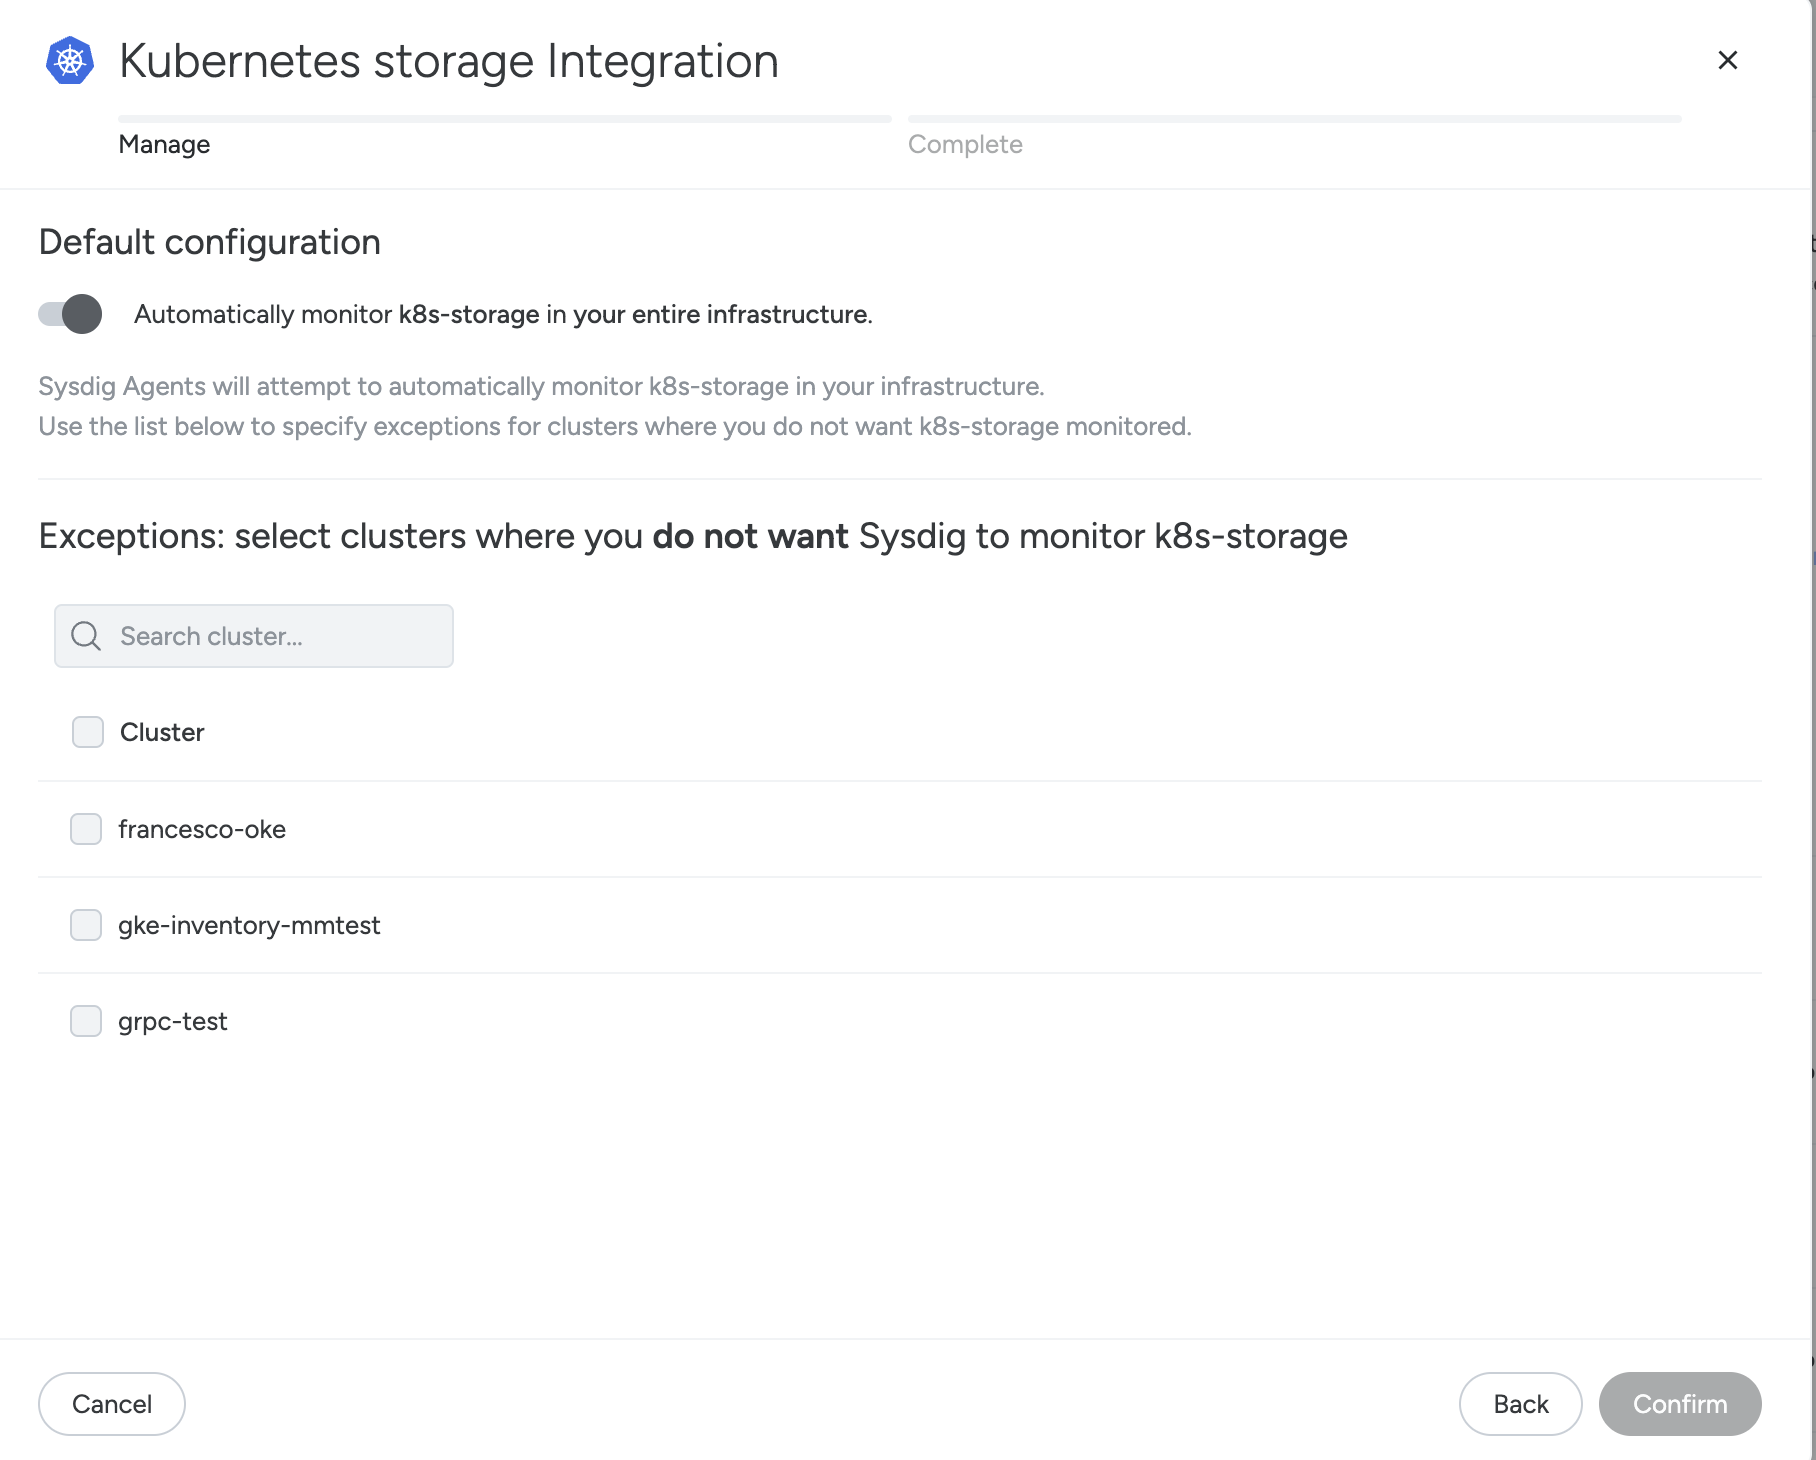
| Select whether this integration is enabled or disabled, and click on Confirm. |
|
If the Manage This integration button is not available, please contact Support.
Customize a Default Job
The default jobs offered by Sysdig for integrations are optimized to scrape the metrics for building dashboards and alerts in Sysdig Monitor. Instead of processing all the metrics available, you can determine which metrics to include or exclude for your requirements. To do so, you can overwrite the default configuration in the prometheus.yaml file. The prometheus.yaml file is located in the sysdig-agent ConfigMap in the sysdig-agent namespace.
You can overwrite the default job for a specific integration by adding a new job to the prometheus.yaml file with the same name as the default job that you want to replace. For example, if you want to create a new job for the Apache integration, create a new job with the name apache-default. The jobs defined by the user has precedence over the default ones.
See Supported Monitoring Integrations for the complete list of integrations and corresponding job names.
Use Sysdig Annotations in Exporters
Sysdig provides a set of Helm charts that helps you configure the exporters for the integrations. For more information on installing Monitor Integrations, see the Monitoring Integrations option in Sysdig Monitor. Additionally, the Helm charts are publicly available in the Sysdig Helm repository.
If exporters are already installed in your cluster, you can use the standard Prometheus annotations and the Sysdig agent will automatically scrape them.
For example, if you use the annotation given below, the incoming metrics will have the information about the pod that generates the metrics.
spec:
  template:
    metadata:
      annotations:
        prometheus.io/path: /metrics
        prometheus.io/port: '9100'
        prometheus.io/scrape: 'true'
If you use an exporter, the incoming metrics will be associated with the exporter pod, not the application pod. To change this behavior, you can use the Sysdig-provided annotations and configure the exporter on the agent.
Annotate the Exporter
Use the following annotations to configure the exporter:
spec:
  template:
    metadata:
      annotations:
        promcat.sysdig.com/port: '9187'
        promcat.sysdig.com/target_ns: my-namespace
        promcat.sysdig.com/target_workload_type: deployment
        promcat.sysdig.com/target_workload_name: my-workload
        promcat.sysdig.com/integration_type: my-integration
port: The port to scrape for metrics on the exporter.target_ns: The namespace of the workload corresponding to the application (not the exporter).target_workload_type: The type of the workload of the application (not the exporter). The possible values aredeployment,statefulset, anddaemonset.target_workload_name: The name of the workload corresponding to the application (not the exporter).integration_type: The type of the integration. The job created in the Sysdig agent use this value to find the exporter.
Configure a New Job
Edit the prometheus.yaml file to configure a new job in Sysdig agent. The file is located in the sysdig-agent ConfigMap in the sysdig-agent namespace.
You can use the following example template:
- job_name: my-integration
  tls_config:
    insecure_skip_verify: true
  kubernetes_sd_configs:
    - role: pod
  relabel_configs:
    - action: keep
      source_labels: [__meta_kubernetes_pod_host_ip]
      regex: __HOSTIPS__
    - action: drop
      source_labels: [__meta_kubernetes_pod_annotation_promcat_sysdig_com_omit]
      regex: true
    - source_labels: [__meta_kubernetes_pod_phase]
      action: keep
      regex: Running
    - action: keep
      source_labels:
        - __meta_kubernetes_pod_annotation_promcat_sysdig_com_integration_type
      regex: 'my-integration' # Use here the integration type that you defined in your annotations
    - action: replace
      source_labels: [__meta_kubernetes_pod_annotation_promcat_sysdig_com_target_ns]
      target_label: kube_namespace_name
    - action: replace
      source_labels: [__meta_kubernetes_pod_annotation_promcat_sysdig_com_target_workload_type]
      target_label: kube_workload_type
    - action: replace
      source_labels: [__meta_kubernetes_pod_annotation_promcat_sysdig_com_target_workload_name]
      target_label: kube_workload_name
    - action: replace
      replacement: true
      target_label: sysdig_omit_source
    - action: replace
      source_labels: [__address__, __meta_kubernetes_pod_annotation_promcat_sysdig_com_port]
      regex: ([^:]+)(?::\d+)?;(\d+)
      replacement: $1:$2
      target_label: __address__
    - action: replace
      source_labels: [__meta_kubernetes_pod_uid]
      target_label: sysdig_k8s_pod_uid
    - action: replace
      source_labels: [__meta_kubernetes_pod_container_name]
      target_label: sysdig_k8s_pod_container_name
Exclude a Deployment from Being Scraped
If you want the agent to exclude a deployment from being scraped, use the following annotation:
spec:
  template:
    metadata:
      annotations:
        promcat.sysdig.com/omit: 'true'