Monitoring Integrations
To access Monitoring Integrations, log in to Sysdig Monitor, and select Integrations > Monitoring Integrations from the left navigation bar.
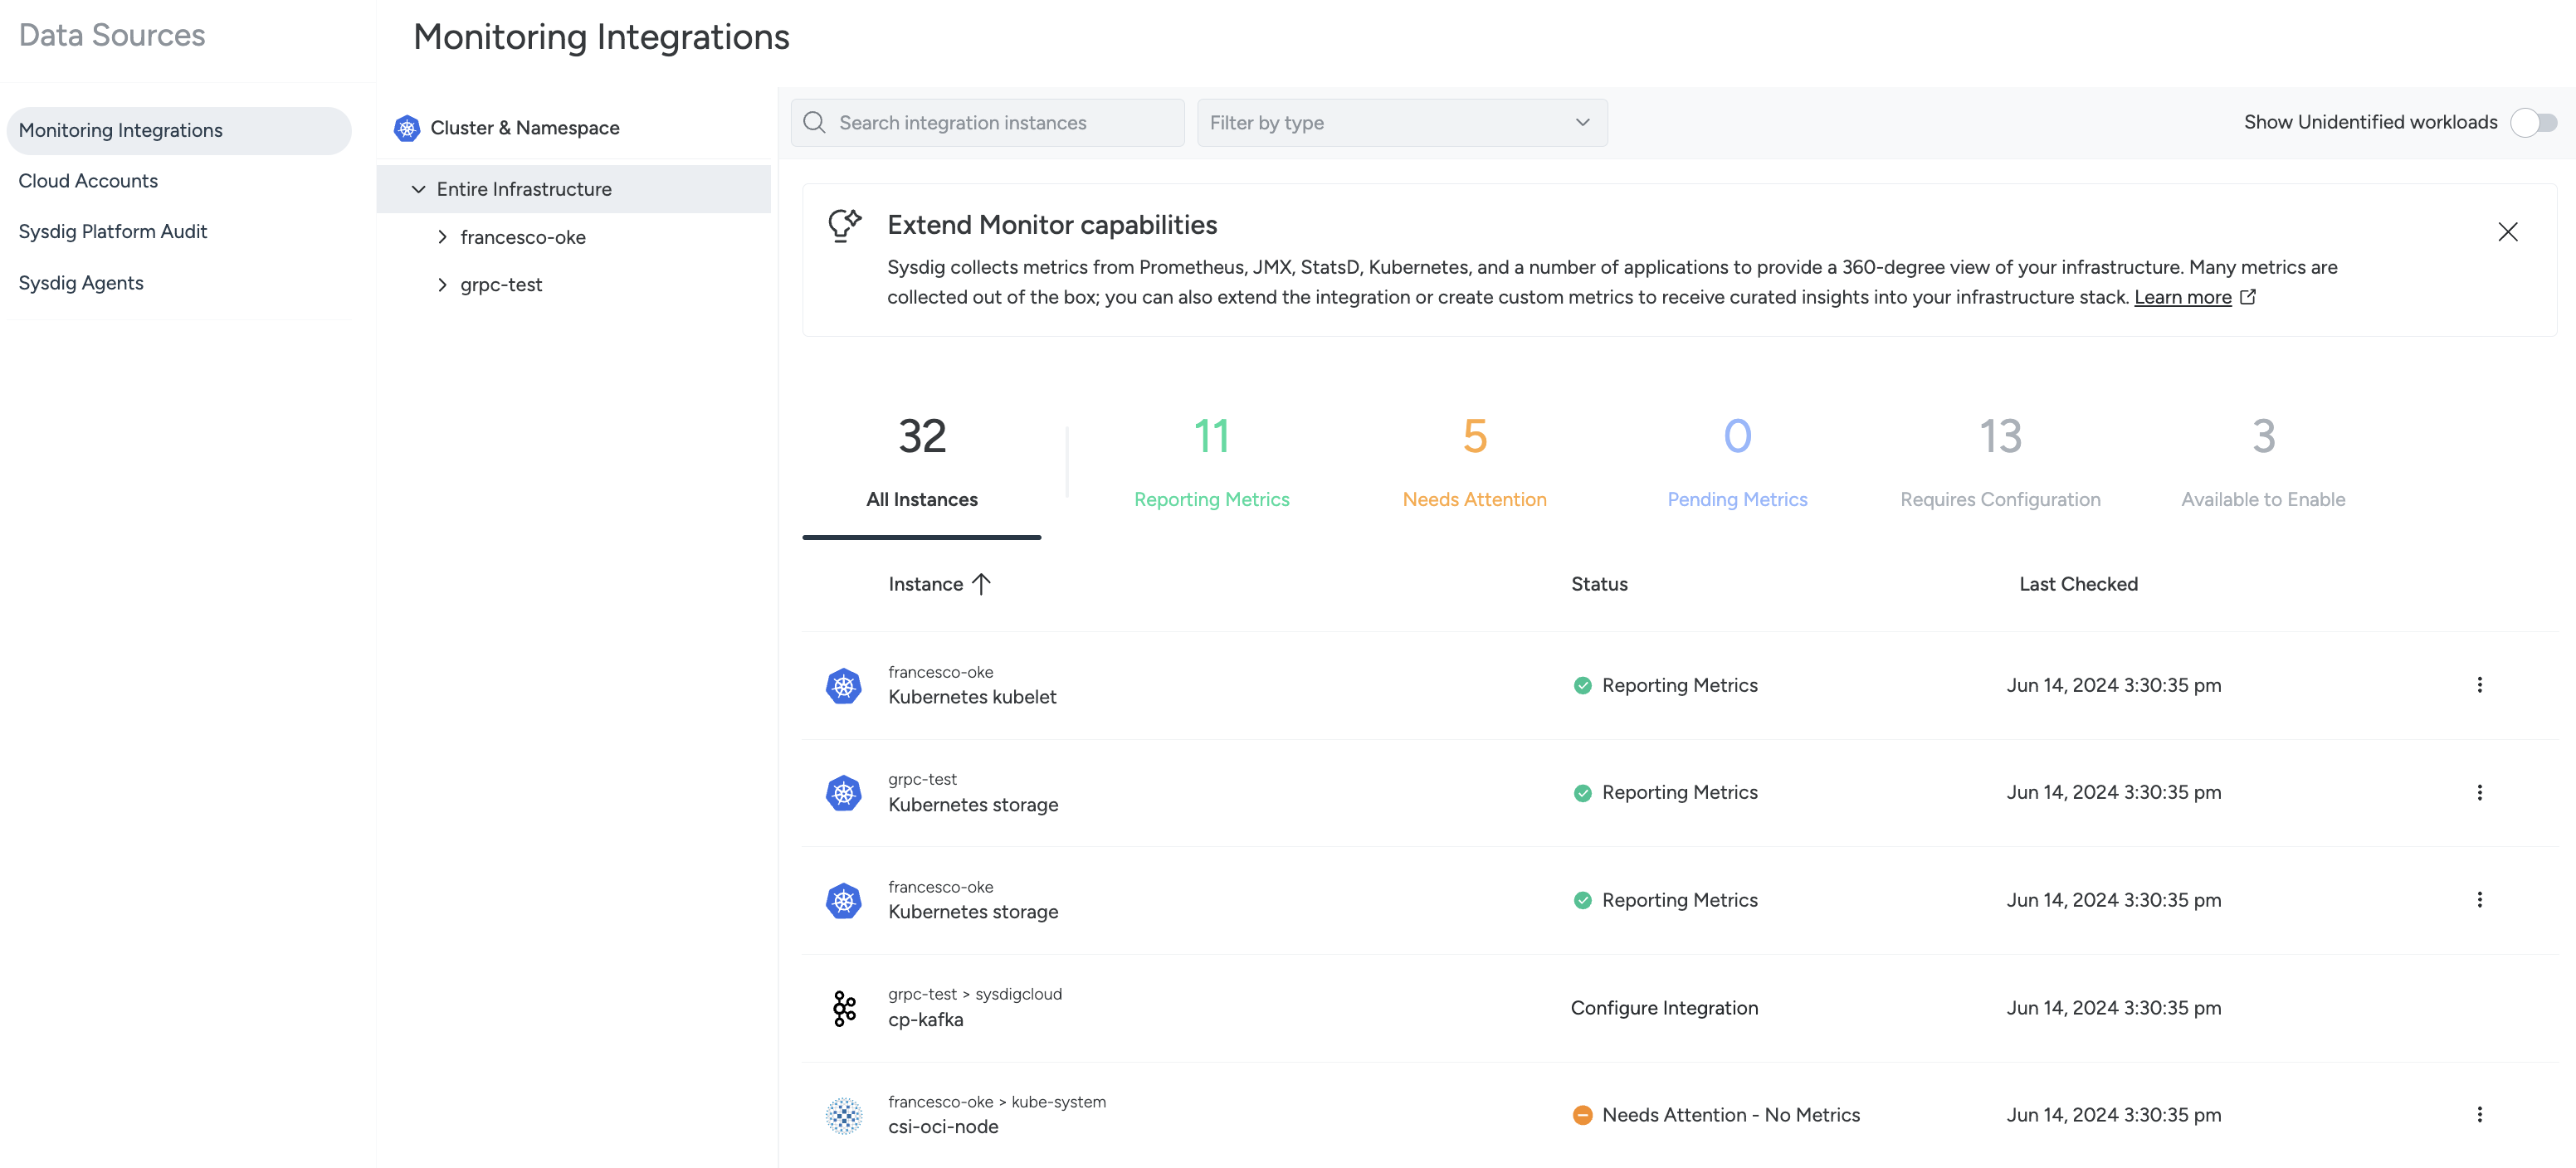
Browse the list on the Monitoring Integrations page to see which workloads Sysdig has detected on your connected environments. Click a listing to find out about the workload in detail. Here, depending on the status of the integration, you can see what metrics are available, configure or manage an integration, and view associated dashboards and alerts.
By default, Sysdig only displays workloads for which it has a default integration. Click the toggle in the top right to Show Unidentified Workload. To collect metrics from unidentified workloads, see Custom Integrations.
Scope, Search, and Filter Integrations
You can narrow down the integrations visible in the Monitoring Integrations list in three ways: by scope, by filter, and by search.
- Scope: Use the directory to the left of the workloads list to view workloads from either your Entire Infrastructure, or from an individual Cluster or Namespace.
- Search: Use the Search bar to search by instance name.
- Filter: Click Filter by type to open a dropdown, where you can filter the integrations identified in your environment.
Integrations Status
The list of All Instances, where every workload meeting your scope, filter and search conditions is listed, is further divided into five categories:
Reporting Metrics
These integrations are configured correctly and are reporting metrics. Click a listing to:
- See when this integration was last checked.
- Enable or disable it globally or per cluster.
- Review types of metrics collected
- Create exceptions to limit the data being collected.
- See the Dashboards using these metrics.
- See linked Alerts.
- View compatibility and installation details.
Needs Attention
These integrations are not reporting metrics. Click on a listing to begin troubleshooting. The issue may be:
- The integration was not correctly identified. See Custom Metrics.
- The agent settings have been configured to disable the integration.
- Check the configuration of the integration and, if necessary, contact support.
Pending Metrics
These integrations have recently been configured and are waiting to receive metrics. This process takes up to 10 minutes to complete.
Requires Configuration
You must configure these integrations to collect metrics. Open the detail page to decide the next steps.
There are two possibilities:
- A wizard-assisted configuration is available from Sysdig.
- No integration has been identified, and you need to create a custom integration. See Custom Integration for details.
Available to Enable
These integrations are ready to collect metrics but are not yet enabled. You might incur costs if you enable them. See Time Series Billing.
Default and Custom Integrations
There are two types of integrations: default integrations and custom integrations.
Default integrations exist for applications found in Sysdig’s Integrations Library: Application integrations, cloud integrations, and infrastructure Integrations all belong under the umbrella of default integrations.
Custom integrations are integrations not natively included by Sysdig. You use custom integrations to collect metrics from a source that is not found in the Integrations Library. This normally involves additional configuration. See Custom Integrations.