Varnish
The Sysdig Agent automatically collects all metrics. You can also edit the configuration to emit service checks for the back end.
This page describes the default configuration settings, how to edit the configuration to collect additional information, the metrics available for integration, and a sample result in the Sysdig Monitor UI.
Varnish Setup
Varnish will automatically expose all metrics. You do not need to add anything to the Varnish instance.
Sysdig Agent Configuration
Review how to Edit dragent.yaml to Integrate or Modify Application Checks.
Default Configuration
By default, Sysdig’s dragent.default.yaml uses the following code to
connect with Varnish and collect all but the VBE metrics. See Example 2
Enable Varnish VBE
Metrics.
metrics_filter:
 - exclude: varnish.VBE.*
app_checks:
 - name: varnishapp_checks:
    interval: 15
    pattern:
      comm: varnishd
    conf:
      varnishstat: /usr/bin/varnishstat
Optionally, if you want to submit service checks for the health of each
back end, you can configure varnishadm and edit dragent.yaml as in
Example 1.
Remember! Never edit dragent.default.yaml directly; always edit
only dragent.yaml.
Example 1 Service Health Checks with varnishadm
When varnishadm is configured, the Sysdig agent requires privileges to
execute the binary with root privileges. Add the following to your
/etc/sudoers file:
sysdig-agent ALL=(ALL) NOPASSWD:/usr/bin/varnishadm
Then edit dragent.yaml as follows. Note: If you have configured
varnishadm and your secret file is NOT /etc/varnish/secret, you can
comment out secretfile.
app_checks:
  - name: varnish
    interval: 15
    pattern:
      comm: varnishd
    conf:
      varnishstat: /usr/bin/varnishstat
      varnishadm: /usr/bin/varnishadm
      secretfile: /etc/varnish/secret
This example will enable following service check.
varnish.backend_healthy: The agent submits a service check for each
Varnish backend, tagging each with backend:<backend_name>.
Example 2 Enable Varnish VBE Metrics
Varnish VBE metrics are dynamically generated (and therefore are not
listed in the Metrics
Dictionary). Because they
generate unique metric names with timestamps, they can clutter metric
handling and are filtered out by default. If you want to collect these
metrics, use include in the metrics_filter in dragent.yaml:
metrics_filter:
 - include: varnish.VBE.*
app_checks:
 - name: varnishapp_checks:
    interval: 15
    pattern:
      comm: varnishd
    conf:
      varnishstat: /usr/bin/varnishstat
Metrics Available
See Varnish Metrics.
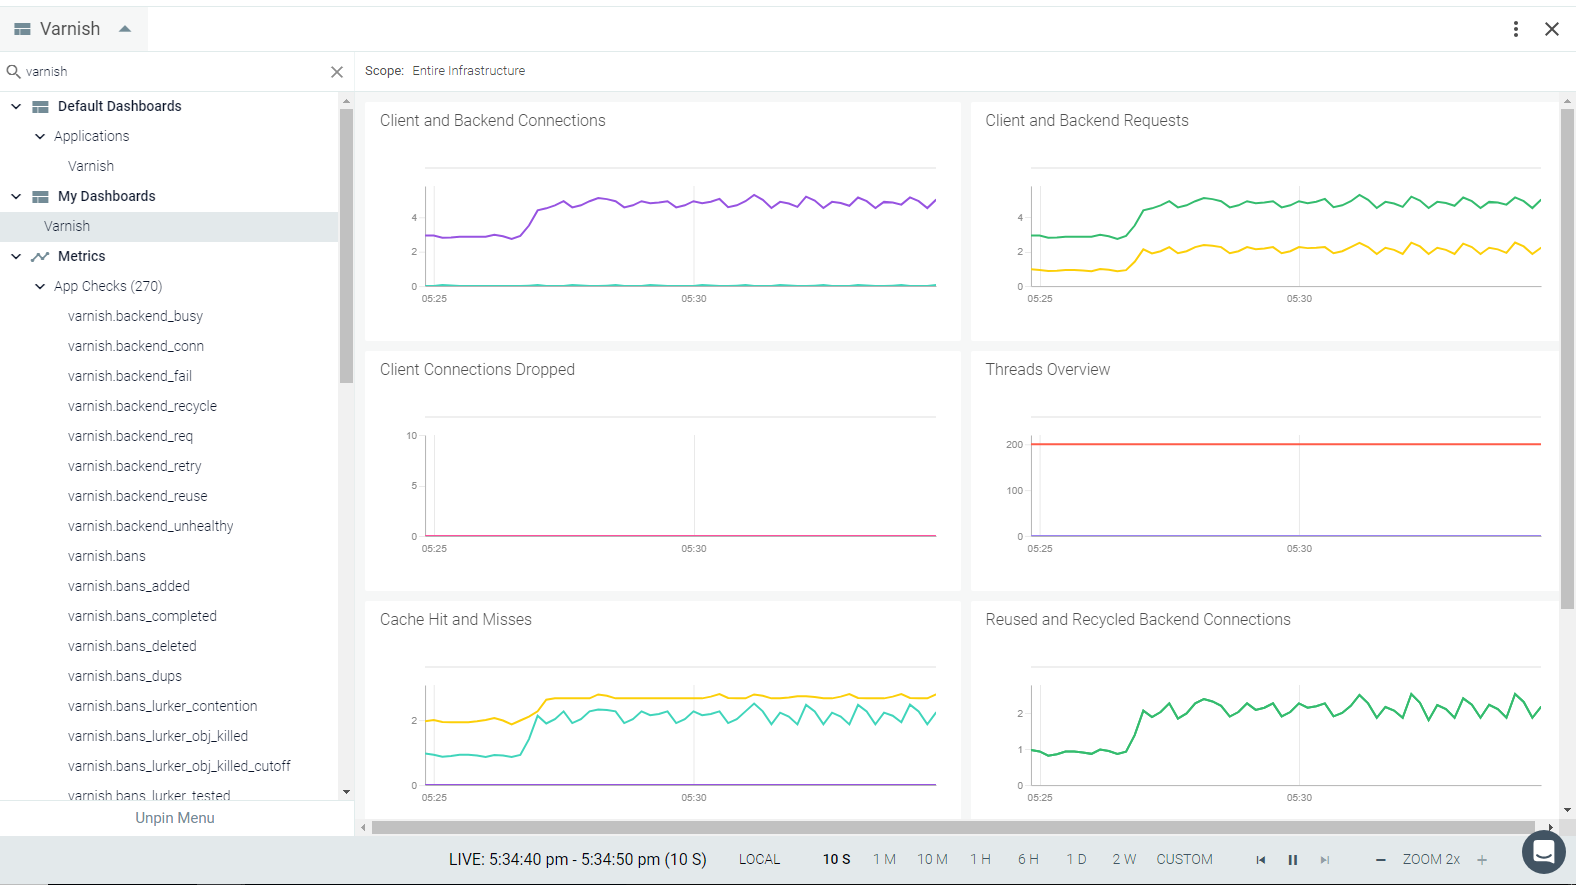
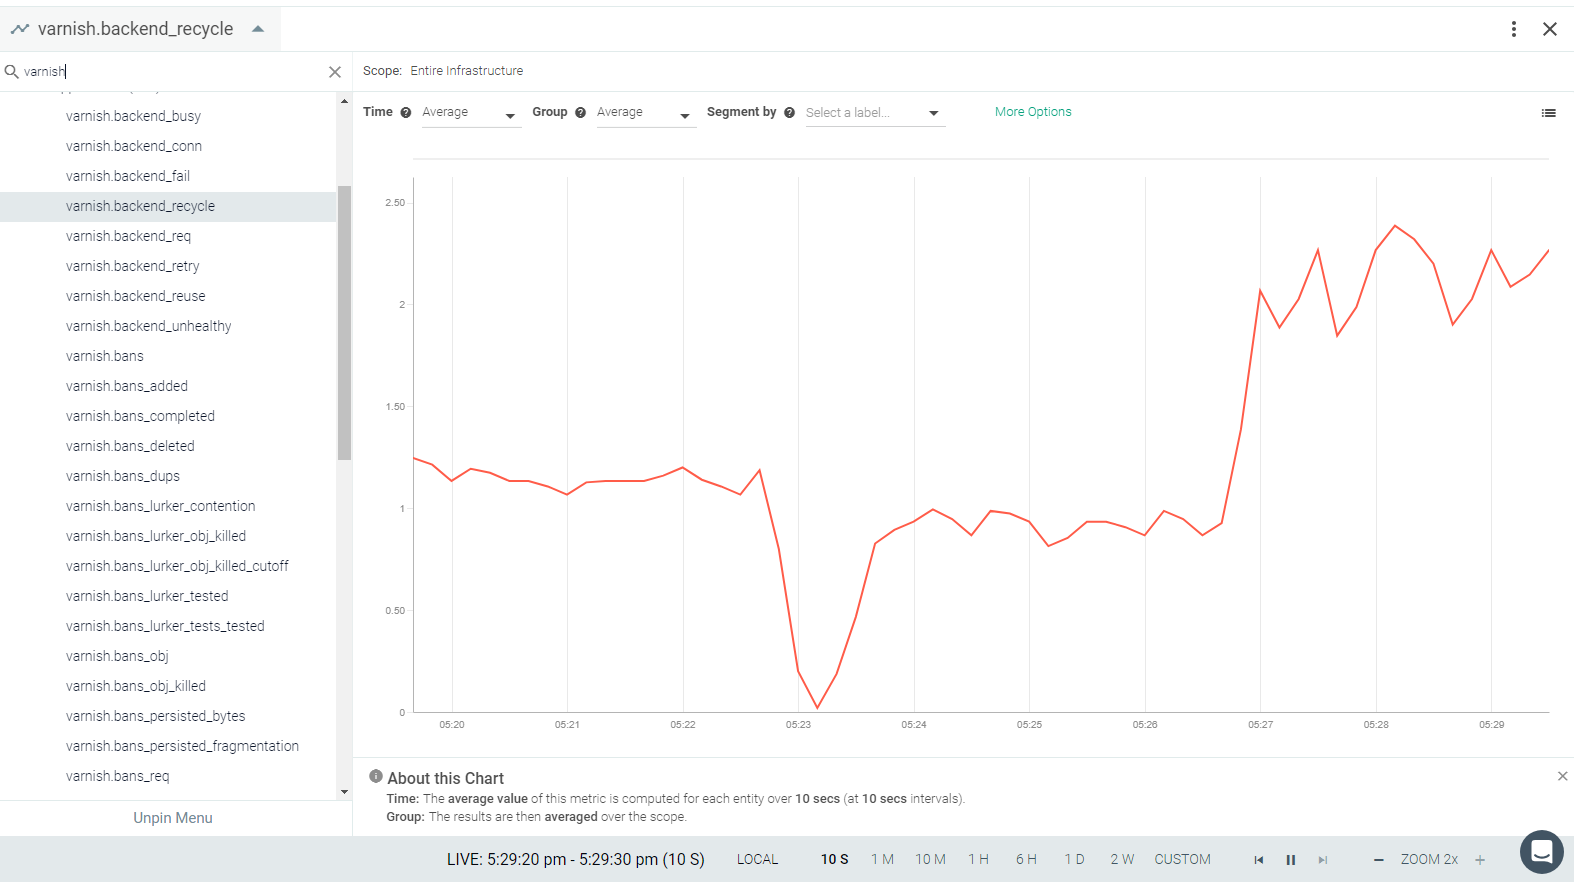
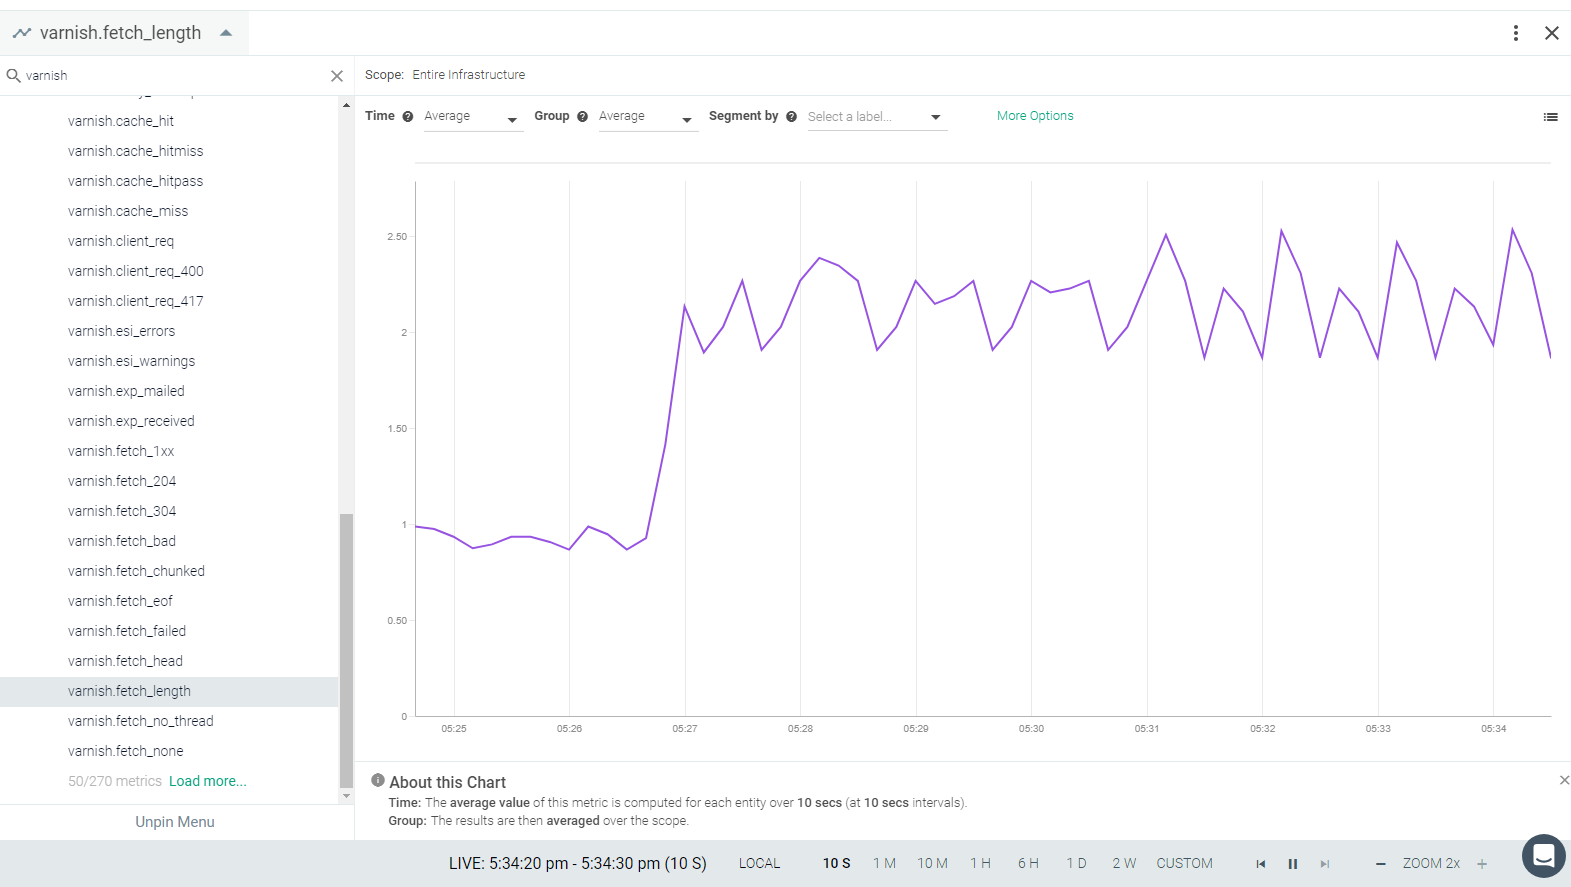
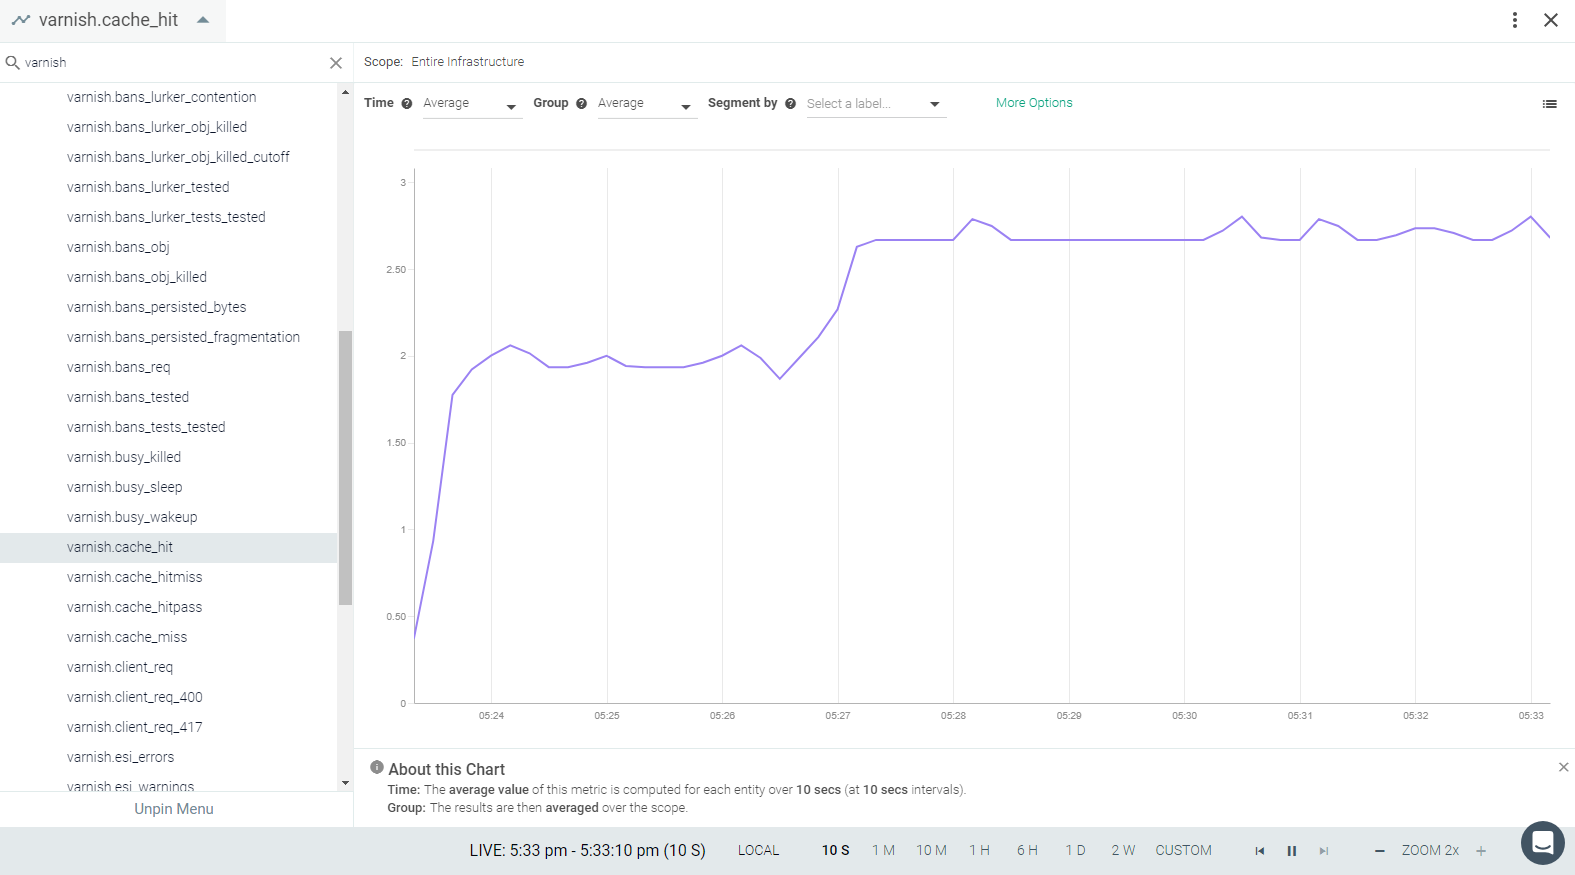
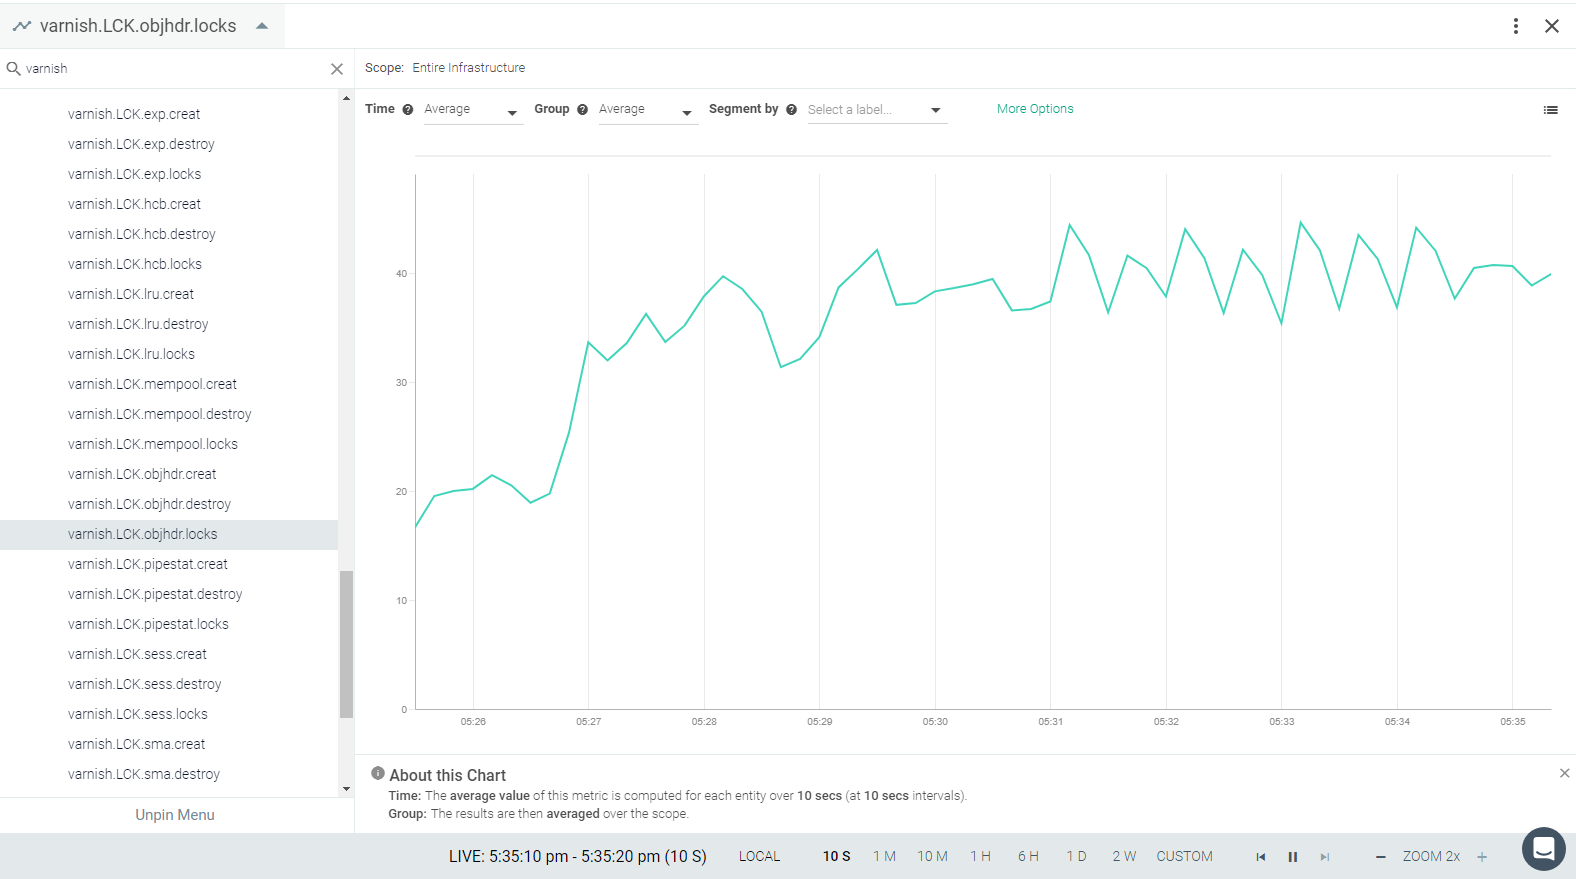
Result in the Monitor UI