TCP
This page describes the default configuration settings, how to edit the configuration to collect additional information, the metrics available for integration, and a sample result in the Sysdig Monitor UI.
TCP Application Setup
Any application listening on a TCP port can be monitored with
tcp_check.
Sysdig Agent Configuration
Review how to Edit dragent.yaml to Integrate or Modify Application Checks.
Default Configuration
No default configuration is provided in the default settings file; you
must add the entries in Example 1 to the user settings config file
dragent.yaml.
Remember! Never edit dragent.default.yaml directly; always edit
only dragent.yaml.
Example
 - name: tcp_check
    check_module: tcp_check
    pattern:
      comm: httpd
      arg: DFOREGROUND
    conf:
      port: 80
      collect_response_time: true
This example shows monitoring a TCP check on an Apache process running on the host on port 80.
comm: is the command for running the Apache server on port 80.
If you want the response time for your port, meaning the amount of time
the process takes to accept the connection, you can add the
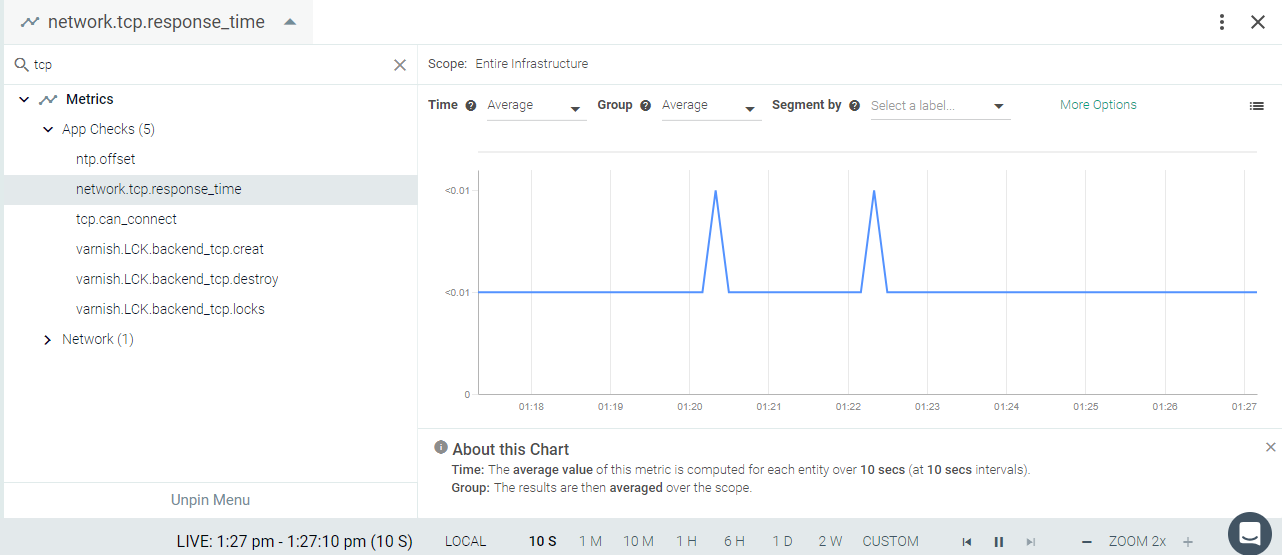
collect_response_time: true parameter under the conf: section and the additional metric network.tcp.response_time will
appear in the Metrics list.
Do not use port: under the pattern: section in this case,
because if the process is not listening it will not be matched and the
metric will not be sent to Sysdig Monitor.
Metrics Available
Metric Name | Metric Description |
|---|---|
network.tcp.response_time (gauge) | The response time of a given host and TCP port, tagged with url, e.g. 'url:192.168.1.100:22'. shown as second |
See TCP Metrics.
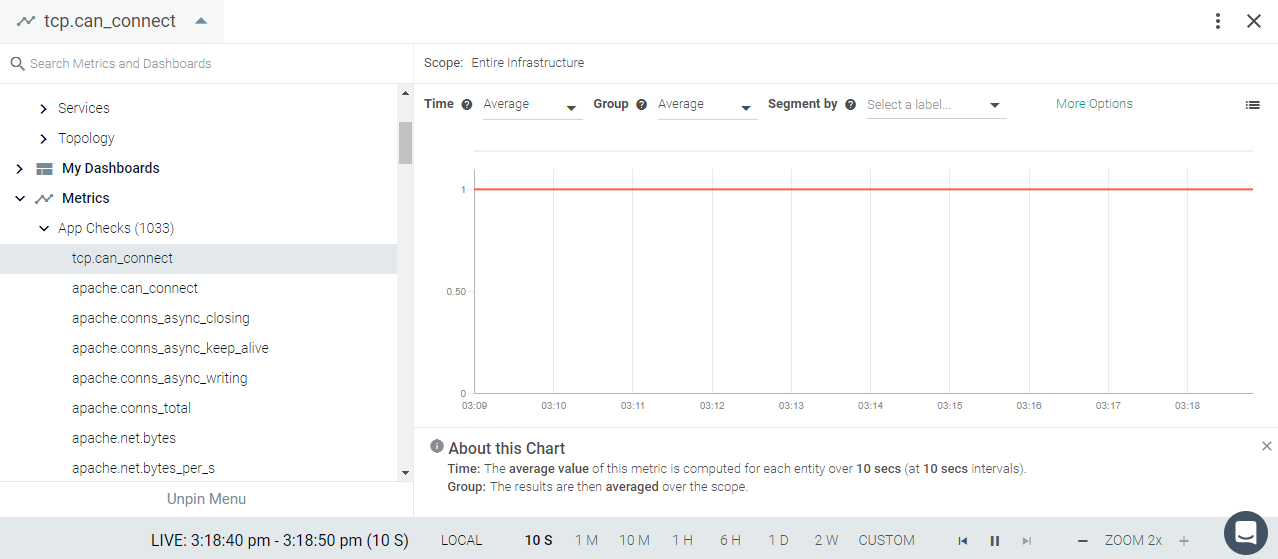
Service Checks
tcp.can_connect :
DOWN if the agent cannot connect to the configured host and port,
otherwise UP.
Result in the Monitor UI