PostgreSQL
If PostgreSQL is installed in your environment, the Sysdig agent will automatically connect in most cases. In some conditions, you may need to create a specific user for Sysdig and edit the default entries to connect.
See the Default Configuration section, below. The Sysdig agent automatically collects all metrics with the default configuration when correct credentials are provided.
This page describes the default configuration settings, how to edit the configuration to collect additional information, the metrics available for integration, and a sample result in the Sysdig Monitor UI.
PostgreSQL Setup
PostgreSQL will be auto-discovered and the agent will connect through
the Unix socket using the Default Configuration with the
**postgres **default user. If this does not work, you can create a
user for Sysdig Monitor and give it enough permissions to read Postgres
stats. To do this, execute the following example statements on your
server:
create user sysdig-cloud with password 'password';
grant SELECT ON pg_stat_database to sysdig_cloud;
Sysdig Agent Configuration
Review how to Edit dragent.yaml to Integrate or Modify Application Checks.
Default Configuration
By default, Sysdig’s default.dragent.yaml uses the following code to
connect with Postgres.
app_checks:
  - name: postgres
    pattern:
      comm: postgres
      port: 5432
    conf:
      unix_sock: "/var/run/postgresql/"
      username: postgres
If a special user for Sysdig is created, then update dragent.yaml file
with the Expanded Example, below.
Never edit default.dragent.yaml directly; always edit only
dragent.yaml.
Example 1: Special User
Update the username and password created for the Sysdig agent in the respective fields, as follows:
app_checks:
  - name: postgres
    pattern:
      comm: postgres
      port: 5432
    conf:
      username: sysdig-cloud
      password: password
Example 2: Connecting on Unix Socket
If Postgres is listening on Unix socket /tmp/.s.PGSQL.5432, set value
of unix_sock to /tmp/
app_checks:
  - name: postgres
    pattern:
      comm: postgres
      port: 5432
    conf:
      unix_sock: "/tmp/"
      username: postgres
Example 3: Relations
Lists of relations/tables can be specified to track per-relation metrics.
A single relation can be specified in two ways:
Single relation with exact name against
relation_name.Regex to include all matching relation against
relation_regex.
If schemas are not provided, all schemas will be included. dbname is
to be provided if relations is specified.
app_checks:
  - name: postgres
    pattern:
      comm: postgres
      port: 5432
    conf:
      username: <username>
      password: <password>
      dbname: <user_db_name>
      relations:
        - relation_name: <table_name_1>
          schemas:
            - <schema_name_1>
        - relation_regex: <table_pattern>
Example 4: Other Optional Parameters
app_checks:
  - name: postgres
    check_module: postgres
    pattern:
      comm: postgres
      port: 5432
    conf:
      username: postgres
      unix_sock: "/var/run/postgresql"
      dbname: <user_db_name>
      #collect_activity_metrics: true
      #collect_default_database: true
      #tag_replication_role: true
Config Parameter | Description | Default Value |
|---|---|---|
collect_activity_metrics | When set to
| false |
collect_default_database | When set to | false |
tag_replication_role | When set to | false |
Optional Parameters
Example 5: Custom Metrics Using Custom Queries
Personalized custom metrics can be collected from Postgres using custom queries.
app_checks:
  - name: postgres
    pattern:
      comm: postgres
      port: 5432
    conf:
      unix_sock: "/var/run/postgresql/"
      username: postgres
      custom_queries:
        - metric_prefix: postgresql.custom
          query: <QUERY>
          columns:
            - name: <COLUNMS_1_NAME>
              type: <COLUMNS_1_TYPE>
            - name: <COLUNMS_2_NAME>
              type: <COLUMNS_2_TYPE>
          tags:
            - <TAG_KEY>:<TAG_VALUE>
| Option | Required | Description |
|---|---|---|
| metric_prefix | Yes | Each metric starts with the chosen prefix. |
| query | Yes | This is the SQL to execute. It can be a simple statement or a multi-line script. All of the rows of the results are evaluated. Use the pipe if you require a multi-line script |
| columns | Yes | This is a list representing each column ordered sequentially from left to right. The number of columns must equal the number of columns returned in the query. There are 2 required pieces of data:- name: This is the suffix to append to the metric_prefix to form the full metric name. If the type is specified as tag, the column is instead applied as a tag to every metric collected by this query.- type: This is the submission method (gauge, count, rate, etc.). This can also be set to ’tag’ to tag each metric in the row with the name and value of the item in this column |
| tags | No | A list of tags to apply to each metric (as specified above). |
Optional Parameters
Metrics Available
See PostgreSQL Metrics.
Result in the Monitor UI
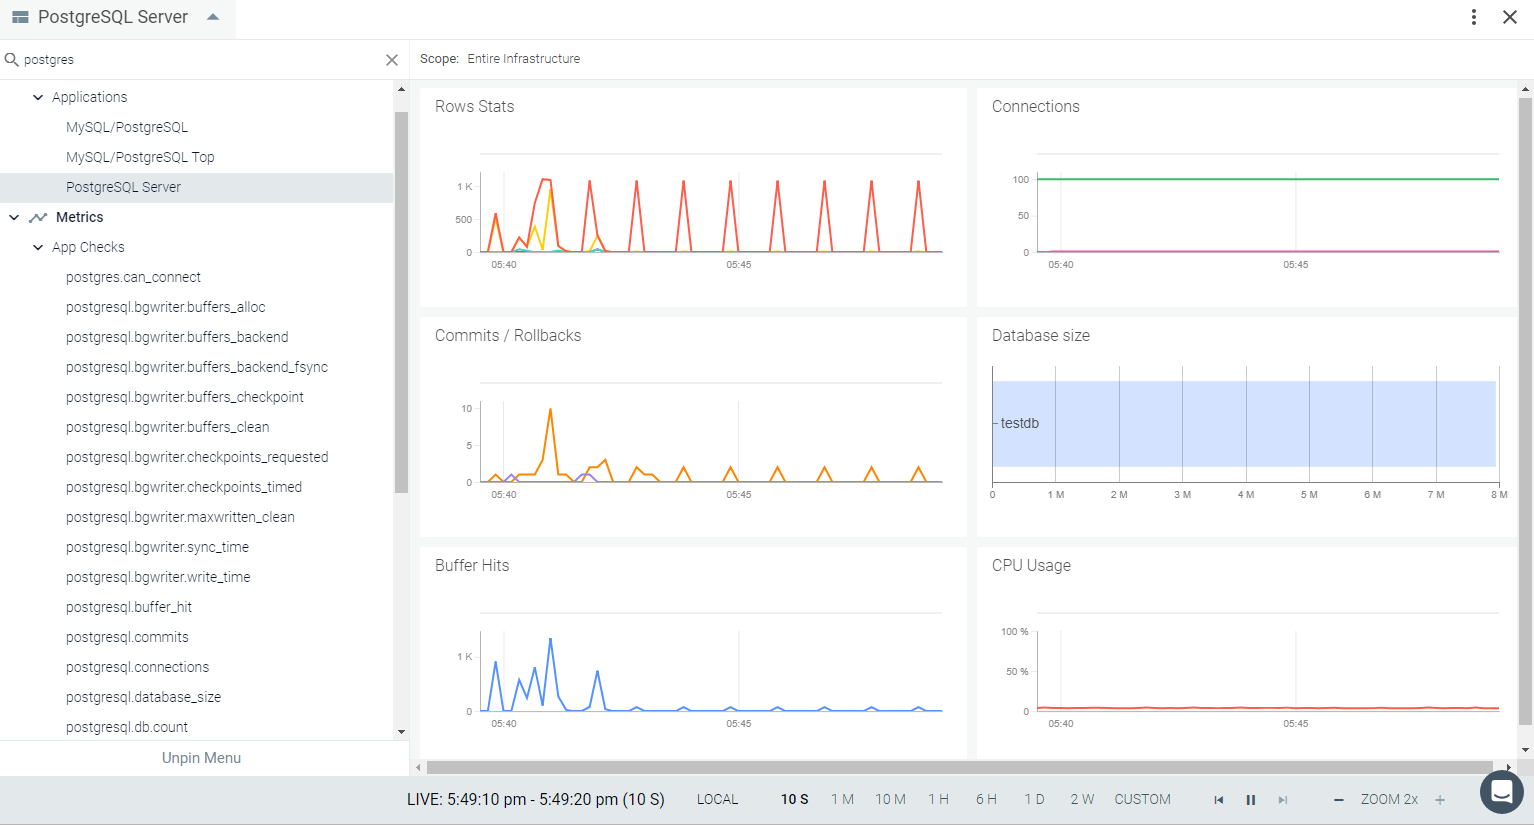
Default Dashboard
The default PostgreSQL dashboard includes combined metrics and individual metrics in an overview page.
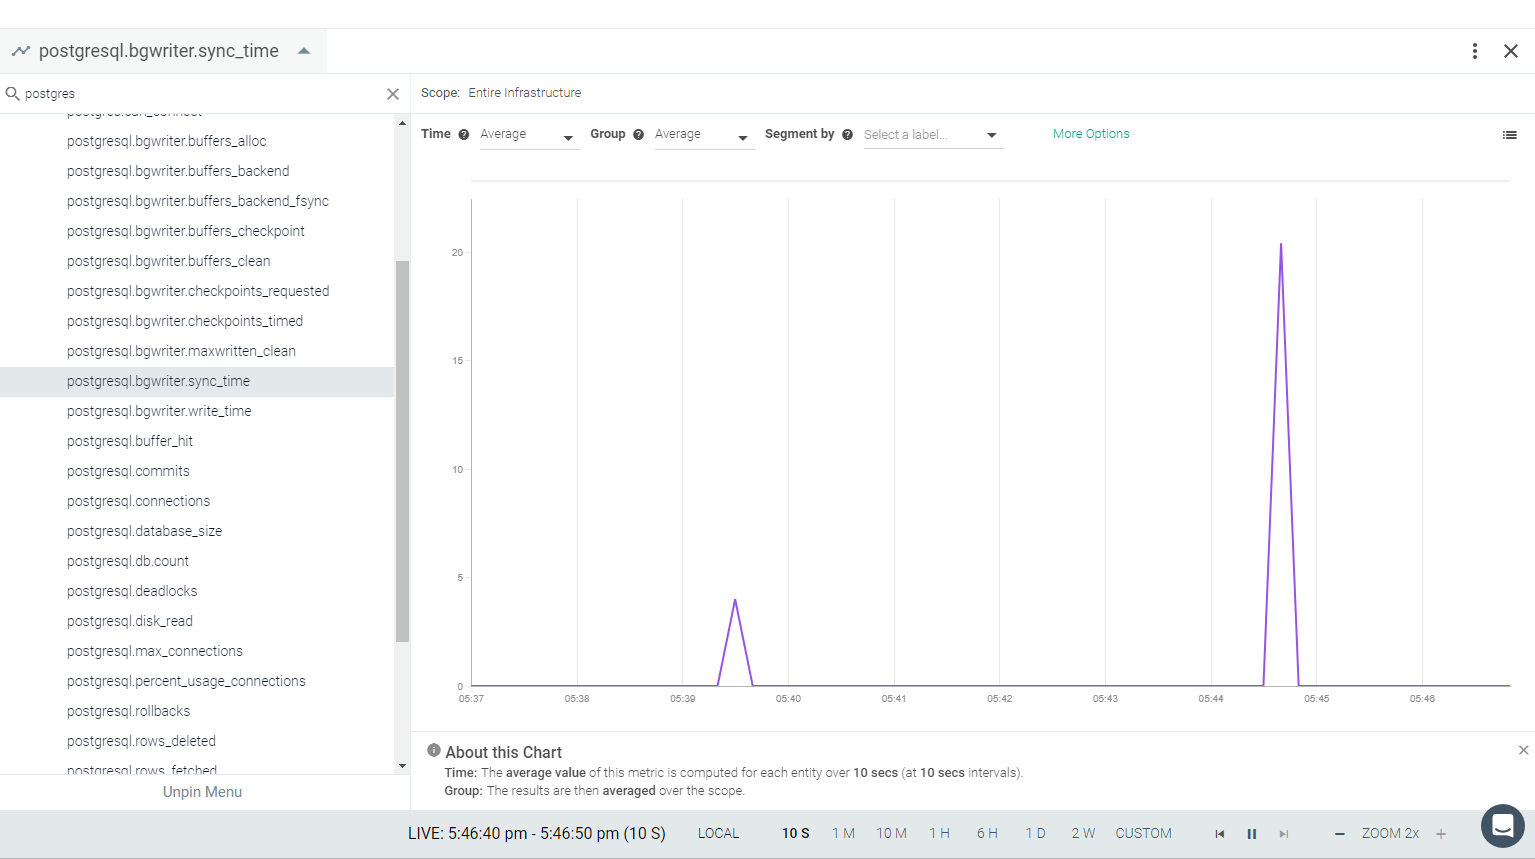
Other Views
You can also view individual metric charts from a drop-down menu in an Explore view.