HAProxy
haproxy metrics. You can also edit the agent configuration file to collect additional metrics.This page describes the default configuration settings, how to edit the configuration to collect additional information, the metrics available for integration, and a sample result in the Sysdig Monitor UI.
HAProxy Setup
The stats feature must be enabled on your HAProxy instance. This can
be done by adding the following entry to the HAProxy configuration file
/etc/haproxy/haproxy.cfg
listen stats
  bind :1936
  mode http
  stats enable
  stats hide-version
  stats realm Haproxy\ Statistics
  stats uri /haproxy_stats
  stats auth stats:stats
Sysdig Agent Configuration
Review how to Edit dragent.yaml to Integrate or Modify Application Checks.
Default Configuration
By default, Sysdig’s dragent.default.yaml uses the following code to
connect with HAProxy and collect haproxy metrics:
app_checks:
  - name: haproxy
    pattern:
      comm: haproxy
      port: 1936
    conf:
      username: stats
      password: stats
      url: http://localhost:1936/
      collect_aggregates_only: True
    log_errors: false
You can get a few additional status metrics by editing the configuration
in dragent.yaml,as in the following examples.
Remember! Never edit dragent.default.yaml directly; always edit
only dragent.yaml
Example: Collect Status Metrics Per Service
Enable the collect_status_metrics flag to collect the metrics
haproxy.count_per_status, and haproxy.backend_hosts.
app_checks:
  - name: haproxy
    pattern:
      comm: haproxy
      port: 1936
    conf:
      username: stats
      password: stats
      url: http://localhost:1936/haproxy_stats
      collect_aggregates_only: True
      collect_status_metrics: True
    log_errors: false
Example: Collect Status Metrics Per Host
Enable:
collect_status_metrics_by_host:Instructs the check to collect status metrics per host, instead of per service. This only applies if`collect_status_metrics`istrue.tag_service_check_by_host:When this flag is set, the hostname is also passed with the service check ‘haproxy.backend_up’.By default, only the backend name and service name are associated with it.
app_checks:
  - name: haproxy
    pattern:
      comm: haproxy
      port: 1936
    conf:
      username: stats
      password: stats
      url: http://localhost:1936/haproxy_stats
      collect_aggregates_only: True
      collect_status_metrics: True
      collect_status_metrics_by_host: True
      tag_service_check_by_host: True
    log_errors: false
Example: Collect HAProxy Stats by UNIX Socket
If you’ve configured HAProxy to report statistics to a UNIX socket, you
can set the url in dragent.yaml to the socket’s path (e.g.,
unix:///var/run/haproxy.sock).
Set up HAProxy Config File
Edit your HAProxy configuration file ( /etc/haproxy/haproxy.cfg )
to add the following lines to the global section:
global
    [snip]
       stats socket /run/haproxy/admin.sock mode 660 level admin
       stats timeout 30s
    [snip]
Edit dragent.yaml url
Add the socket URL from the HAProxy config to the dragent.yaml file:
app_checks:
      - name: haproxy
        pattern:
          comm: haproxy
        conf:
          url: unix:///run/haproxy/admin.sock
        log_errors: True
Metrics Available
See HAProxy Metrics.
Example: Enable Service Check
Required: Agent 9.6.0+
enable_service_check: Enable/Disable service
check haproxy.backend.up.
When set to false , all service checks will be disabled.
app_checks:
  - name: haproxy
    pattern:
      comm: haproxy
      port: 1936
    conf:
      username: stats
      password: stats
      url: http://localhost:1936/haproxy_stats
      collect_aggregates_only: true
      enable_service_check: false
Example: Filter Metrics Per Service
Required: Agent 9.6.0+
services_exclude (Optional): Name or regex of services to be excluded.
services_include (Optional): Name or regex of services to be included
If a service is excluded with services_exclude, it can still be be
included explicitly by services_include. The following example
excludes all services except service_1 and service_2.
app_checks:
  - name: haproxy
    pattern:
      comm: haproxy
      port: 1936
    conf:
      username: stats
      password: stats
      url: http://localhost:1936/haproxy_stats
      collect_aggregates_only: true
      services_exclude:
        - ".*"
      services_include:
        - "service_1"
        - "service_2"
Additional Options: active_tag, headers
Required: Agent 9.6.0+
There are two additional configuration options introduced with agent 9.6.0:
active_tag(Optional. Default:false):Adds tag
activeto backend metrics that belong to the active pool of connections.headers(Optional):Extra headers such as
auth-tokencan be passed along with requests.
app_checks:
  - name: haproxy
    pattern:
      comm: haproxy
      port: 1936
    conf:
      username: stats
      password: stats
      url: http://localhost:1936/haproxy_stats
      collect_aggregates_only: true
      active_tag: true
      headers:
        <HEADER_NAME>: <HEADER_VALUE>
        <HEADER_NAME>: <HEADER_VALUE>
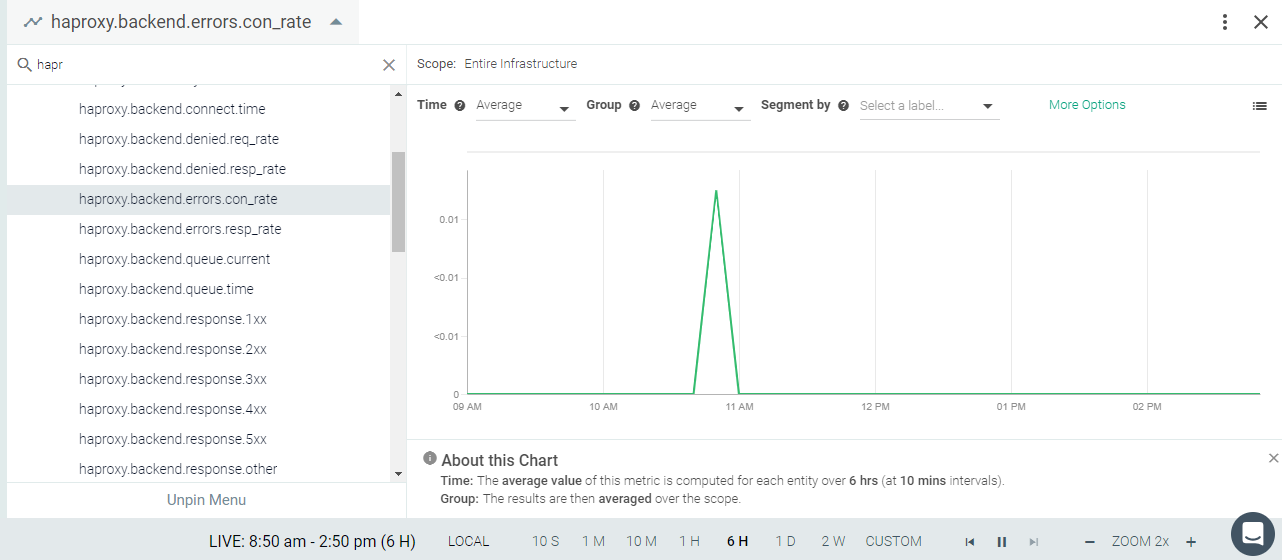
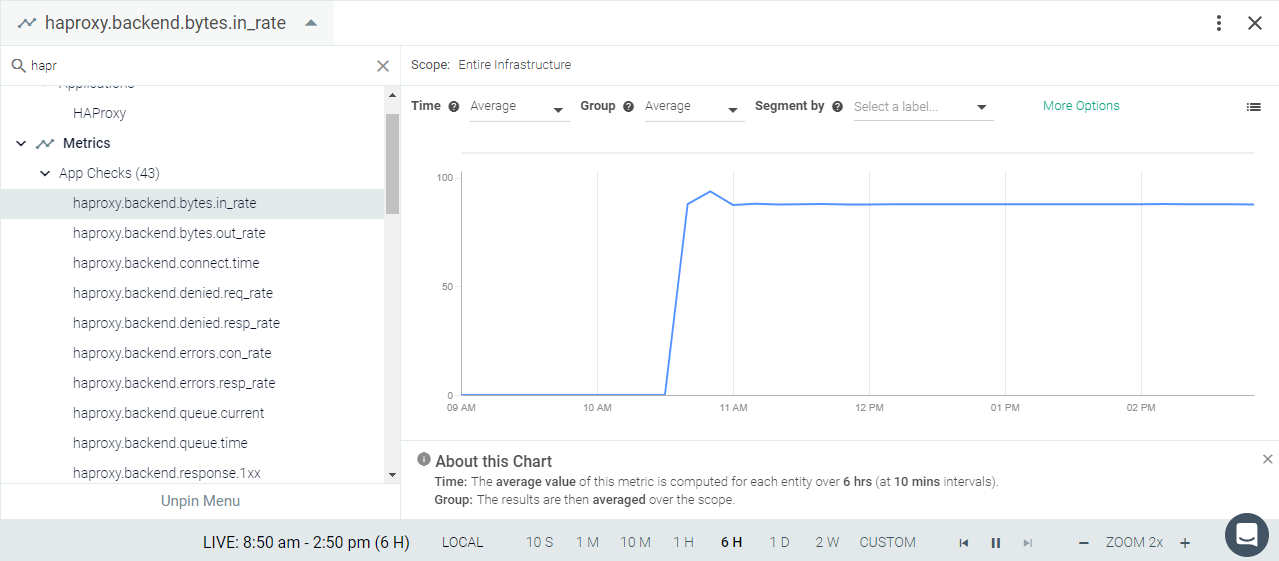
Result in the Monitor UI