Go
Go program via HTTP. In addition to custom metrics, it also exports some metrics out-of-the-box, such as command line arguments, allocation stats, heap stats, and garbage collection metrics.This page describes the default configuration settings, how to edit the configuration to collect additional information, the metrics available for integration, and a sample result in the Sysdig Monitor UI.
Go_expvar Setup
You will need to create a custom entry in the user settings config file
for your Go application, due to the difficulty in determining if an
application is written in Go by looking at process names or arguments.
Be sure your app has expvars enabled, which means importing the
expvar module and having an HTTP server started from inside your
app, as follows:
import (
    ...
    "net/http"
    "expvar"
    ...
)

// If your application has no http server running for the DefaultServeMux,
// you'll have to have a http server running for expvar to use, for example
// by adding the following to your init function
func init() {
    go http.ServeAndListen(":8080", nil)
}

// You can also expose variables that are specific to your application
// See http://golang.org/pkg/expvar/ for more information

var (
    exp_points_processed = expvar.NewInt("points_processed")
)

func processPoints(p RawPoints) {
    points_processed, err := parsePoints(p)
    exp_points_processed.Add(points_processed)
    ...
}
See also the following blog entry: How to instrument Go code with custom expvar metrics.
Sysdig Agent Configuration
Review how to Edit dragent.yaml to Integrate or Modify Application Checks.
Default Configuration
No default configuration for Go is provided in the Sysdig agent
dragent.default.yaml file. You must edit the agent config file as
described in Example 1.
Remember! Never edit dragent.default.yaml directly; always edit
only dragent.yaml.
Example
Add the following code sample to dragent.yaml to collect Go metrics.
app_checks:
  - name: go-expvar
    check_module: go_expvar
    pattern:
          comm: go-expvar
    conf:
      expvar_url: "http://localhost:8080/debug/vars" # automatically match url using the listening port
      # Add custom metrics if you want
      metrics:
        - path: system.numberOfSeconds
          type: gauge # gauge or rate
          alias: go_expvar.system.numberOfSeconds
        - path: system.lastLoad
          type: gauge
          alias: go_expvar.system.lastLoad
        - path: system.numberOfLoginsPerUser/.* # You can use / to get inside the map and use .* to match any record inside
          type: gauge
        - path: system.allLoad/.*
          type: gauge
Metrics Available
See Go Metrics.
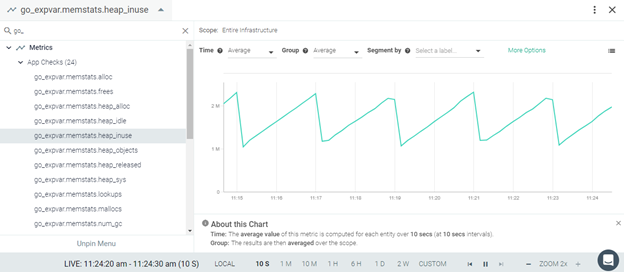
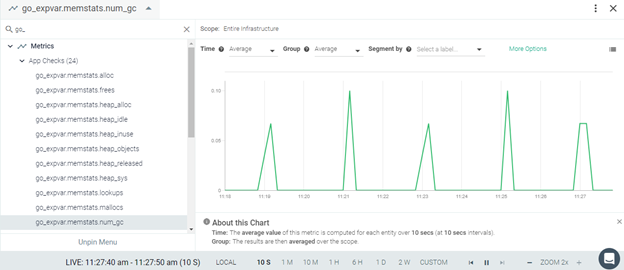
Result in the Monitor UI