Elasticsearch
You can edit the configuration to collect Primary Shard stats.
This page describes the default configuration settings, how to edit the configuration to collect additional information, the metrics available for integration, and a sample result in the Sysdig Monitor UI.
Elasticsearch Setup
Elasticsearch is ready to expose metrics without any special configuration.
Sysdig Agent Configuration
Review how to edit dragent.yaml to Integrate or Modify Application Checks.
Default Configuration
By default, Sysdig’s dragent.default.yaml uses the following code to
connect with Elasticsearch and collect basic metrics.
app_checks:
  - name: elasticsearch
    check_module: elastic
    pattern:
      port: 9200
      comm: java
    conf:
      url: http://localhost:9200
For more metrics, you may need to change the elasticsearch default
setting in dragent.yaml:
Remember! Never edit dragent.default.yaml directly; always edit
only dragent.yaml.
Example 1: Agent authentication to Elasticsearch Cluster with Authentication
Password Authentication
app_checks:
  - name: elasticsearch
    check_module: elastic
    pattern:
      port: 9200
      comm: java
    conf:
      url: https://sysdigcloud-elasticsearch:9200
      username: readonly
      password: some_password
      ssl_verify: false
Certificate Authentication
app_checks:
   - name: elasticsearch
     check_module: elastic
     pattern:
       port: 9200
       comm: java
     conf:
       url: https://localhost:9200
       ssl_cert: /tmp/certs/ssl.crt
       ssl_key: /tmp/certs/ssl.key
       ssl_verify: true
ssl_cert: Path to the certificate chain used for validating the
authenticity of the Elasticsearch server.
ssl_key: Path to the certificate key used for authenticating to the
Elasticsearch server.
Example 2: Enable Primary shard Statistics
app_checks:
  - name: elasticsearch
    check_module: elastic
    pattern:
      port: 9200
      comm: java
    conf:
      url: http://localhost:9200
      pshard_stats : true
pshard-specific Metrics
Enable pshard_stats to monitor the following additional metrics:
| Metric Name |
|---|
| elasticsearch.primaries.flush.total |
| elasticsearch.primaries.flush.total.time |
| elasticsearch.primaries.docs.count |
| elasticsearch.primaries.docs.deleted |
| elasticsearch.primaries.get.current |
| elasticsearch.primaries.get.exists.time |
| elasticsearch.primaries.get.exists.total |
| elasticsearch.primaries.get.missing.time |
| elasticsearch.primaries.get.missing.total |
| elasticsearch.primaries.get.time |
| elasticsearch.primaries.get.total |
| elasticsearch.primaries.indexing.delete.current |
| elasticsearch.primaries.indexing.delete.time |
| elasticsearch.primaries.indexing.delete.total |
| elasticsearch.primaries.indexing.index.current |
| elasticsearch.primaries.indexing.index.time |
| elasticsearch.primaries.indexing.index.total |
| elasticsearch.primaries.merges.current |
| elasticsearch.primaries.merges.current.docs |
| elasticsearch.primaries.merges.current.size |
| elasticsearch.primaries.merges.total |
| elasticsearch.primaries.merges.total.docs |
| elasticsearch.primaries.merges.total.size |
| elasticsearch.primaries.merges.total.time |
| elasticsearch.primaries.refresh.total |
| elasticsearch.primaries.refresh.total.time |
| elasticsearch.primaries.search.fetch.current |
| elasticsearch.primaries.search.fetch.time |
| elasticsearch.primaries.search.fetch.total |
| elasticsearch.primaries.search.query.current |
| elasticsearch.primaries.search.query.time |
| elasticsearch.primaries.search.query.total |
| elasticsearch.primaries.store.size |
Example 3: Enable Primary shard Statistics for Master Node only
app_checks:
  - name: elasticsearch
    check_module: elastic
    pattern:
      port: 9200
      comm: java
    conf:
      url: http://localhost:9200
      pshard_stats_master_node_only: true
Note that this option takes precedence over the pshard_stats option
(above). This means that if the following configuration were put into
place, only the pshard_stats_master_node_only option would be
respected:
app_checks:
  - name: elasticsearch
    check_module: elastic
    pattern:
      port: 9200
      comm: java
    conf:
      url: http://localhost:9200
      pshard_stats: true
      pshard_stats_master_node_only: true
All Available Metrics
With the default settings and the pshard setting, the total available
metrics are listed here: Elasticsearch
Metrics.
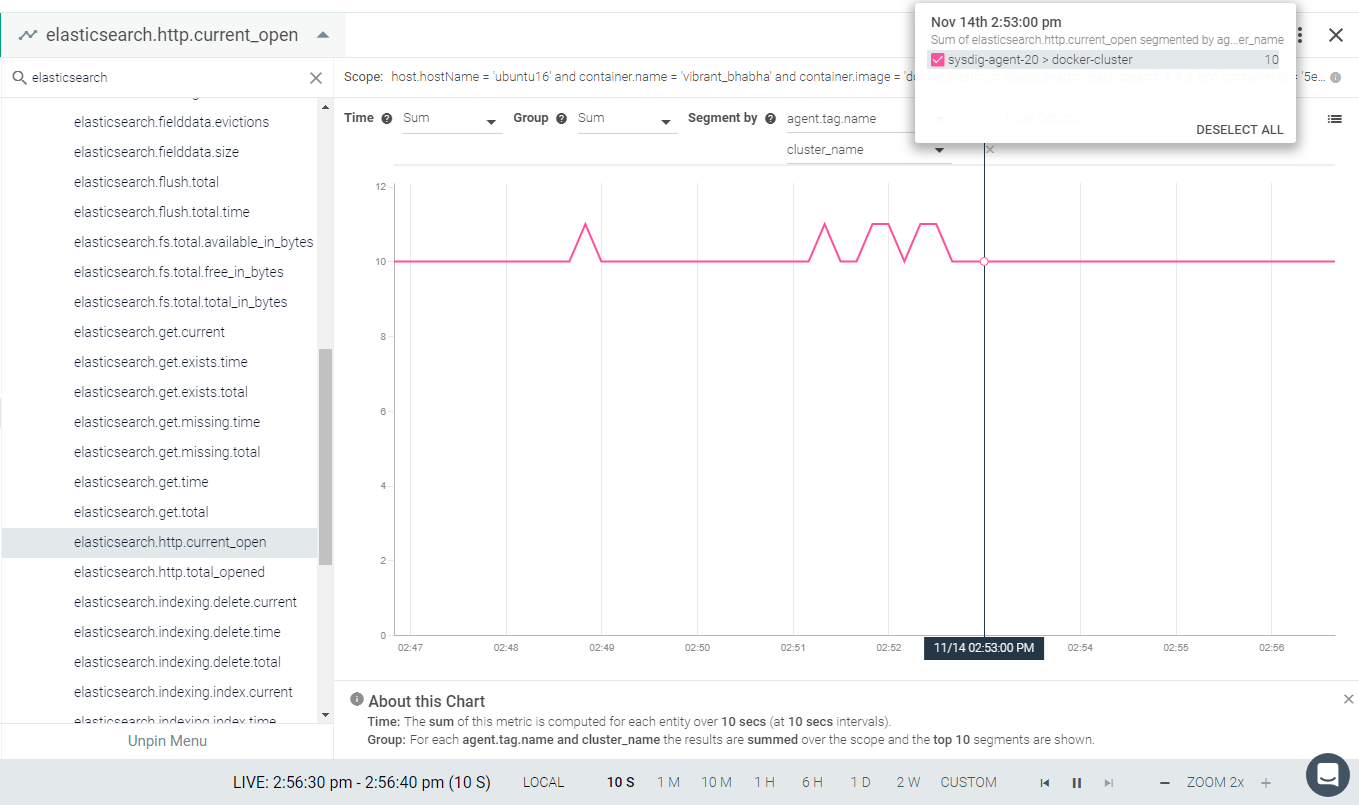
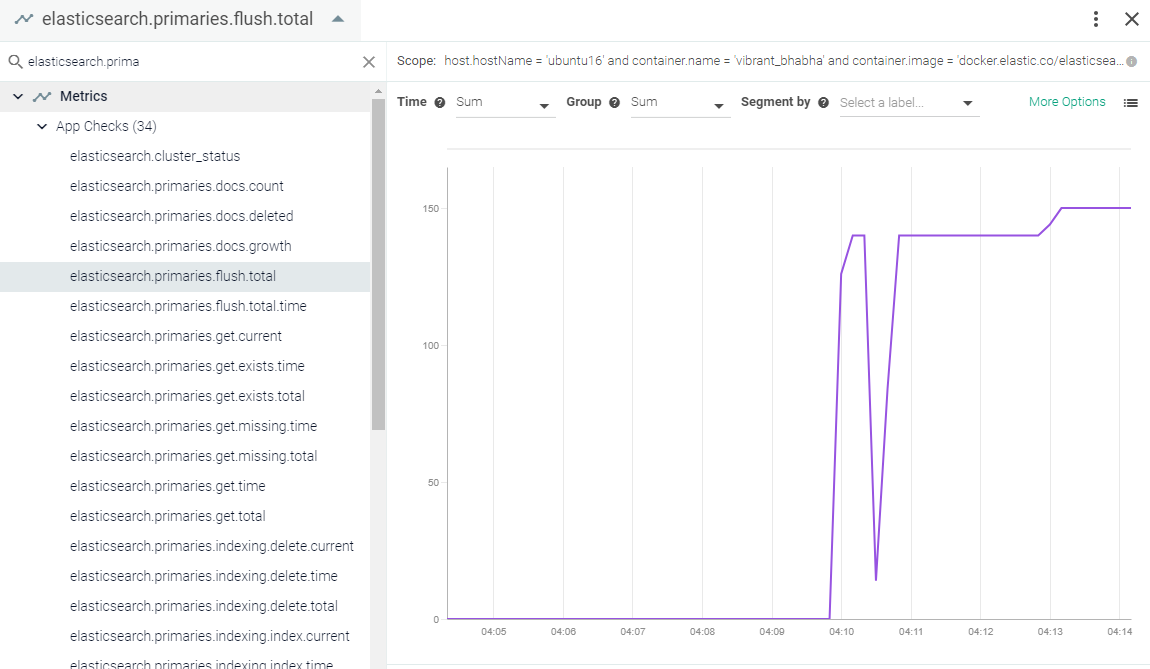
Result in the Monitor UI