Consul
It’s easy! Sysdig automatically detects metrics from this app based on standard default configurations.
This page describes the default configuration settings, how to edit the configuration to collect additional information, the metrics available for integration, and a sample result in the Sysdig Monitor UI.
Consul Configuration
Consul is ready to expose metrics without any special configuration.
Sysdig Agent Configuration
Review how to edit dragent.yaml to Integrate or Modify Application Checks.
Default Configuration
By default, Sysdig’s dragent.default.yaml ``uses the following code to
connect with Consul and collect basic metrics.
app_checks:
  - name: consul
    pattern:
      comm: consul
    conf:
      url: "http://localhost:8500"
      catalog_checks: yes
With the dragent.default.yaml file, the below set of metrics are
available in the Sysdig Monitor UI:
| Metrics name |
|---|
| consul.catalog.nodes_critical |
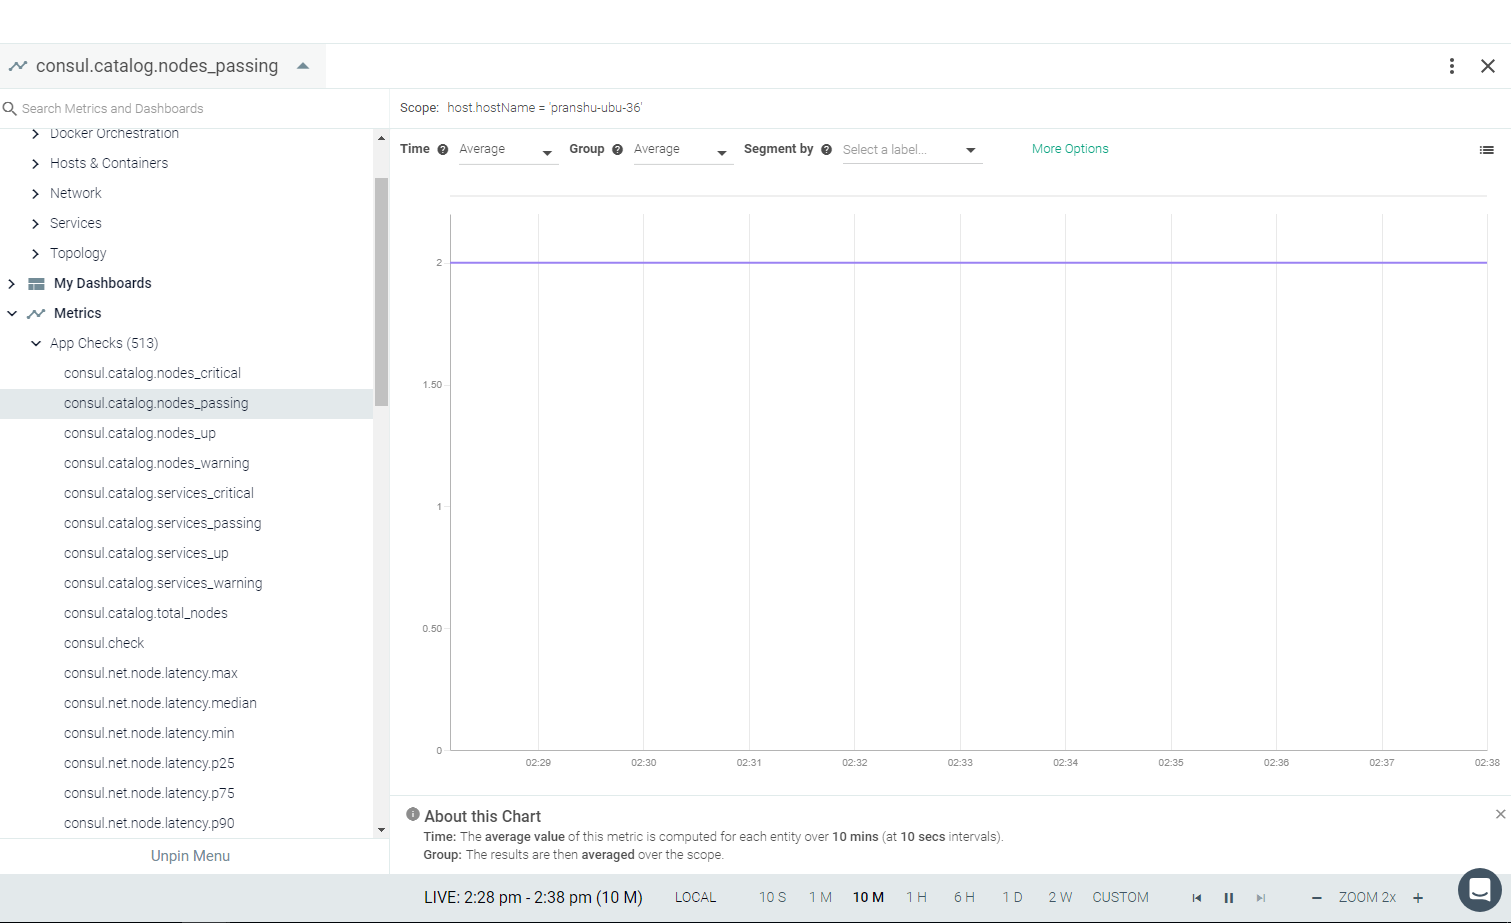
| consul.catalog.nodes_passing |
| consul.catalog.nodes_up |
| consul.catalog.nodes_warning |
| consul.catalog.total_nodes |
| consul.catalog.services_critical |
| consul.catalog.services_passing |
| consul.catalog.services_up |
| consul.catalog.services_warning |
| consul.peers |
Additional metrics and event can be collected by adding configuration in
dragent.yaml file. The ACL token must be provided if enabled. See the
following examples.
Remember! Never edit dragent.default.yaml ``directly; always edit
only dragent.yaml.
Example 1: Enable Leader Change Event
self_leader_check An enabled node will watch for itself to become the
leader and will emit an event when that happens. It can be enabled on
all nodes.
app_checks:
  - name: consul
    pattern:
      comm: consul
    conf:
      url: "http://localhost:8500"
      catalog_checks: yes
      self_leader_check: yes
    logs_enabled: true
Example 2: Enable Latency Metrics
If the network_latency_checks flag is enabled, then the Consul network
coordinates will be retrieved and the latency calculated for each node
and between data centers.
app_checks:
  - name: consul
    pattern:
      comm: consul
    conf:
      url: "http://localhost:8500"
      catalog_checks: yes
      network_latency_checks: yes
    logs_enabled: true
With the above changes, you can see the following additional metrics:
| Metrics name |
|---|
| consul.net.node.latency.min |
| consul.net.node.latency.p25 |
| consul.net.node.latency.median |
| consul.net.node.latency.p75 |
| consul.net.node.latency.p90 |
| consul.net.node.latency.p95 |
| consul.net.node.latency.p99 |
| consul.net.node.latency.max |
Example 3: Enable ACL Token
When the ACL Systemis enabled in Consul, the ACL Agent Token must
be added in dragent.yaml in order to collect metrics.
Follow Consul’s official documentation to Configure ACL, Bootstrap ACL and Create Agent Token.
app_checks:
  - name: consul
    pattern:
      comm: consul
    conf:
      url: "http://localhost:8500"
      acl_token: "xxxxxxxx-xxxx-xxxx-xxxx-xxxxxxxxxxxx" #Add agent token
      catalog_checks: yes
      logs_enabled: true
Example 4: Collect Metrics from Non-Leader Node
Required: Agent 9.6.0+
With agent 9.6.0, you can use the configuration option
single_node_install (Optional. Default: false). Set this option to
true and the app check will be performed on non-leader nodes of
Consul.
app_checks:
   - name: consul
    pattern:
      comm: consul
    conf:
      url: "http://localhost:8500"
      catalog_checks: yes
      single_node_install: true
StatsD Metrics
In addition to the metrics from the Sysdig app-check, there are many other metrics that Consul can send using StatsD. Those metrics will be automatically collected by the Sysdig agent’s StatsD integration if Consul is configured to send them.
Add statsd_address under telemetry to the Consul config file. The
default config file location is /consul/config/local.json
{
...
  "telemetry": {
     "statsd_address": "127.0.0.1:8125"
  }
...
}
See Telemetry Metrics for more details.
Metrics Available
See Consul Metrics.
Result in the Monitor UI