(Legacy) Working with Prometheus Metrics
Latest Prometheus Features
Sysdig agents v12.0 or above is required for the following capabilities:
Sysdig agents v10.0 or above is required for the following capabilities:
New capabilities of using Prometheus data:
Ability to visualize data using PromQL queries. See Using PromQL.
Create alerts from PromQL-based Dashboards. See Create Panel Alerts.
Backward compatibility for dashboards v2 and alerts.
The new PromQL data cannot be visualized by using the Dashboard v2 Histogram. Use time-series based visualization for the histogram metrics.
10-second data granularity
Higher retention rate on the new metric store.
Prerequisites and Guidelines
Sysdig agent v 10.0.0 and above is required for the latest Prometheus features.
Prometheus feature is enabled in the
dragent.yamlfile.prometheus: enabled: trueSee Setting up the Environment for more information.
The endpoints of the target should be available on a TCP connection to the agent. The agent scrapes a target, remote or local, specified by the
IP: Portor theURLindragent.yaml.
Service Discovery
To use native Prometheus service discovery, enable Promscrape V2 as described in Enable Prometheus Native Service Discovery. This section covers the Sysdig way of service discovery that involves configuring process filters in the Sysdig agent.
The way service discovery works in the Sysdig agent differs from that of
the Prometheus server.
While the Prometheus server has built-in integration with several
service discovery mechanisms and the prometheus.yml file to read the
configuration settings from, the Sysdig agent auto-discovers any process
(exporter or instrumented) that matches the specifications in the
dragent.yaml, file and instructs the embedded lightweight Prometheus
server to retrieve the metrics from it.
The lightweight Prometheus server in the agent is named promscrape and
is controlled by the flag of the same name in the dragent.yaml file.
See Configuring Sysdig Agent for more information.
Unlike the Prometheus server that can scrape processes running on all the machines in a cluster, the agent can scrape only those processes that are running on the host that it is installed on.
Within the set of eligible processes/ports/endpoints, the agent scrapes only the ports that are exporting Prometheus metrics and will stop attempting to scrape or retry on ports based on how they respond to attempts to connect and scrape them. It is therefore strongly recommended that you create a configuration that restricts the process and ports for attempted scraping to the minimum expected range for your exporters. This minimizes the potential for unintended side-effects in both the Agent and your applications due to repeated failed connection attempts.
The end to end metric collection can be summarized as follows:
A process is determined to be eligible for possible scraping if it positively matches against a series of Process Filter include/exclude rules. See Process Filter for more information.
The Agent will then attempt to scrape an eligible process at a
/metricsendpoint on all of its listening TCP ports unless the additional configuration is present to restrict scraping to a subset of ports and/or another endpoint name.Upon receiving the metrics, the agent applies the following rules before sending them to the Sysdig collector.
Applies the global
metrics_filterrules.Imposes the configured
max_metricsto limit the number of metrics.
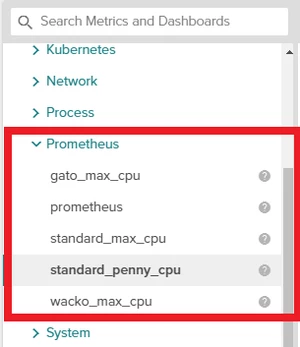
The metrics ultimately appear in the Sysdig Monitor Explore interface in the Prometheus section.