Traefik
Metrics, Dashboards, Alerts and more for Traefik Integration in Sysdig Monitor.

This integration is enabled by default.
Versions supported: > v2.0
This integration is out-of-the-box, so it doesn’t require any exporter.
This integration has 44 metrics.
Timeseries generated: 1500
List of Alerts
| Alert | Description | Format |
|---|---|---|
| [Traefik] High Http 5xx Error Rate | Too many HTTP requests with status 5xx (over 5%) | Prometheus |
| [Traefik] High Http 4xx Error Rate | Too many HTTP requests with status 4xx (over 10%) | Prometheus |
| [Traefik] High Latency | Traefik mean service latency is higher than 1 second | Prometheus |
| [Traefik] Config Reload Failure | Traefik failed to reload its configuration. New routes or TLS certificates are not being applied | Prometheus |
| [Traefik] No Traefik Instances Running | No Traefik instances are reporting metrics. Ingress traffic may be completely disrupted | Prometheus |
List of Dashboards
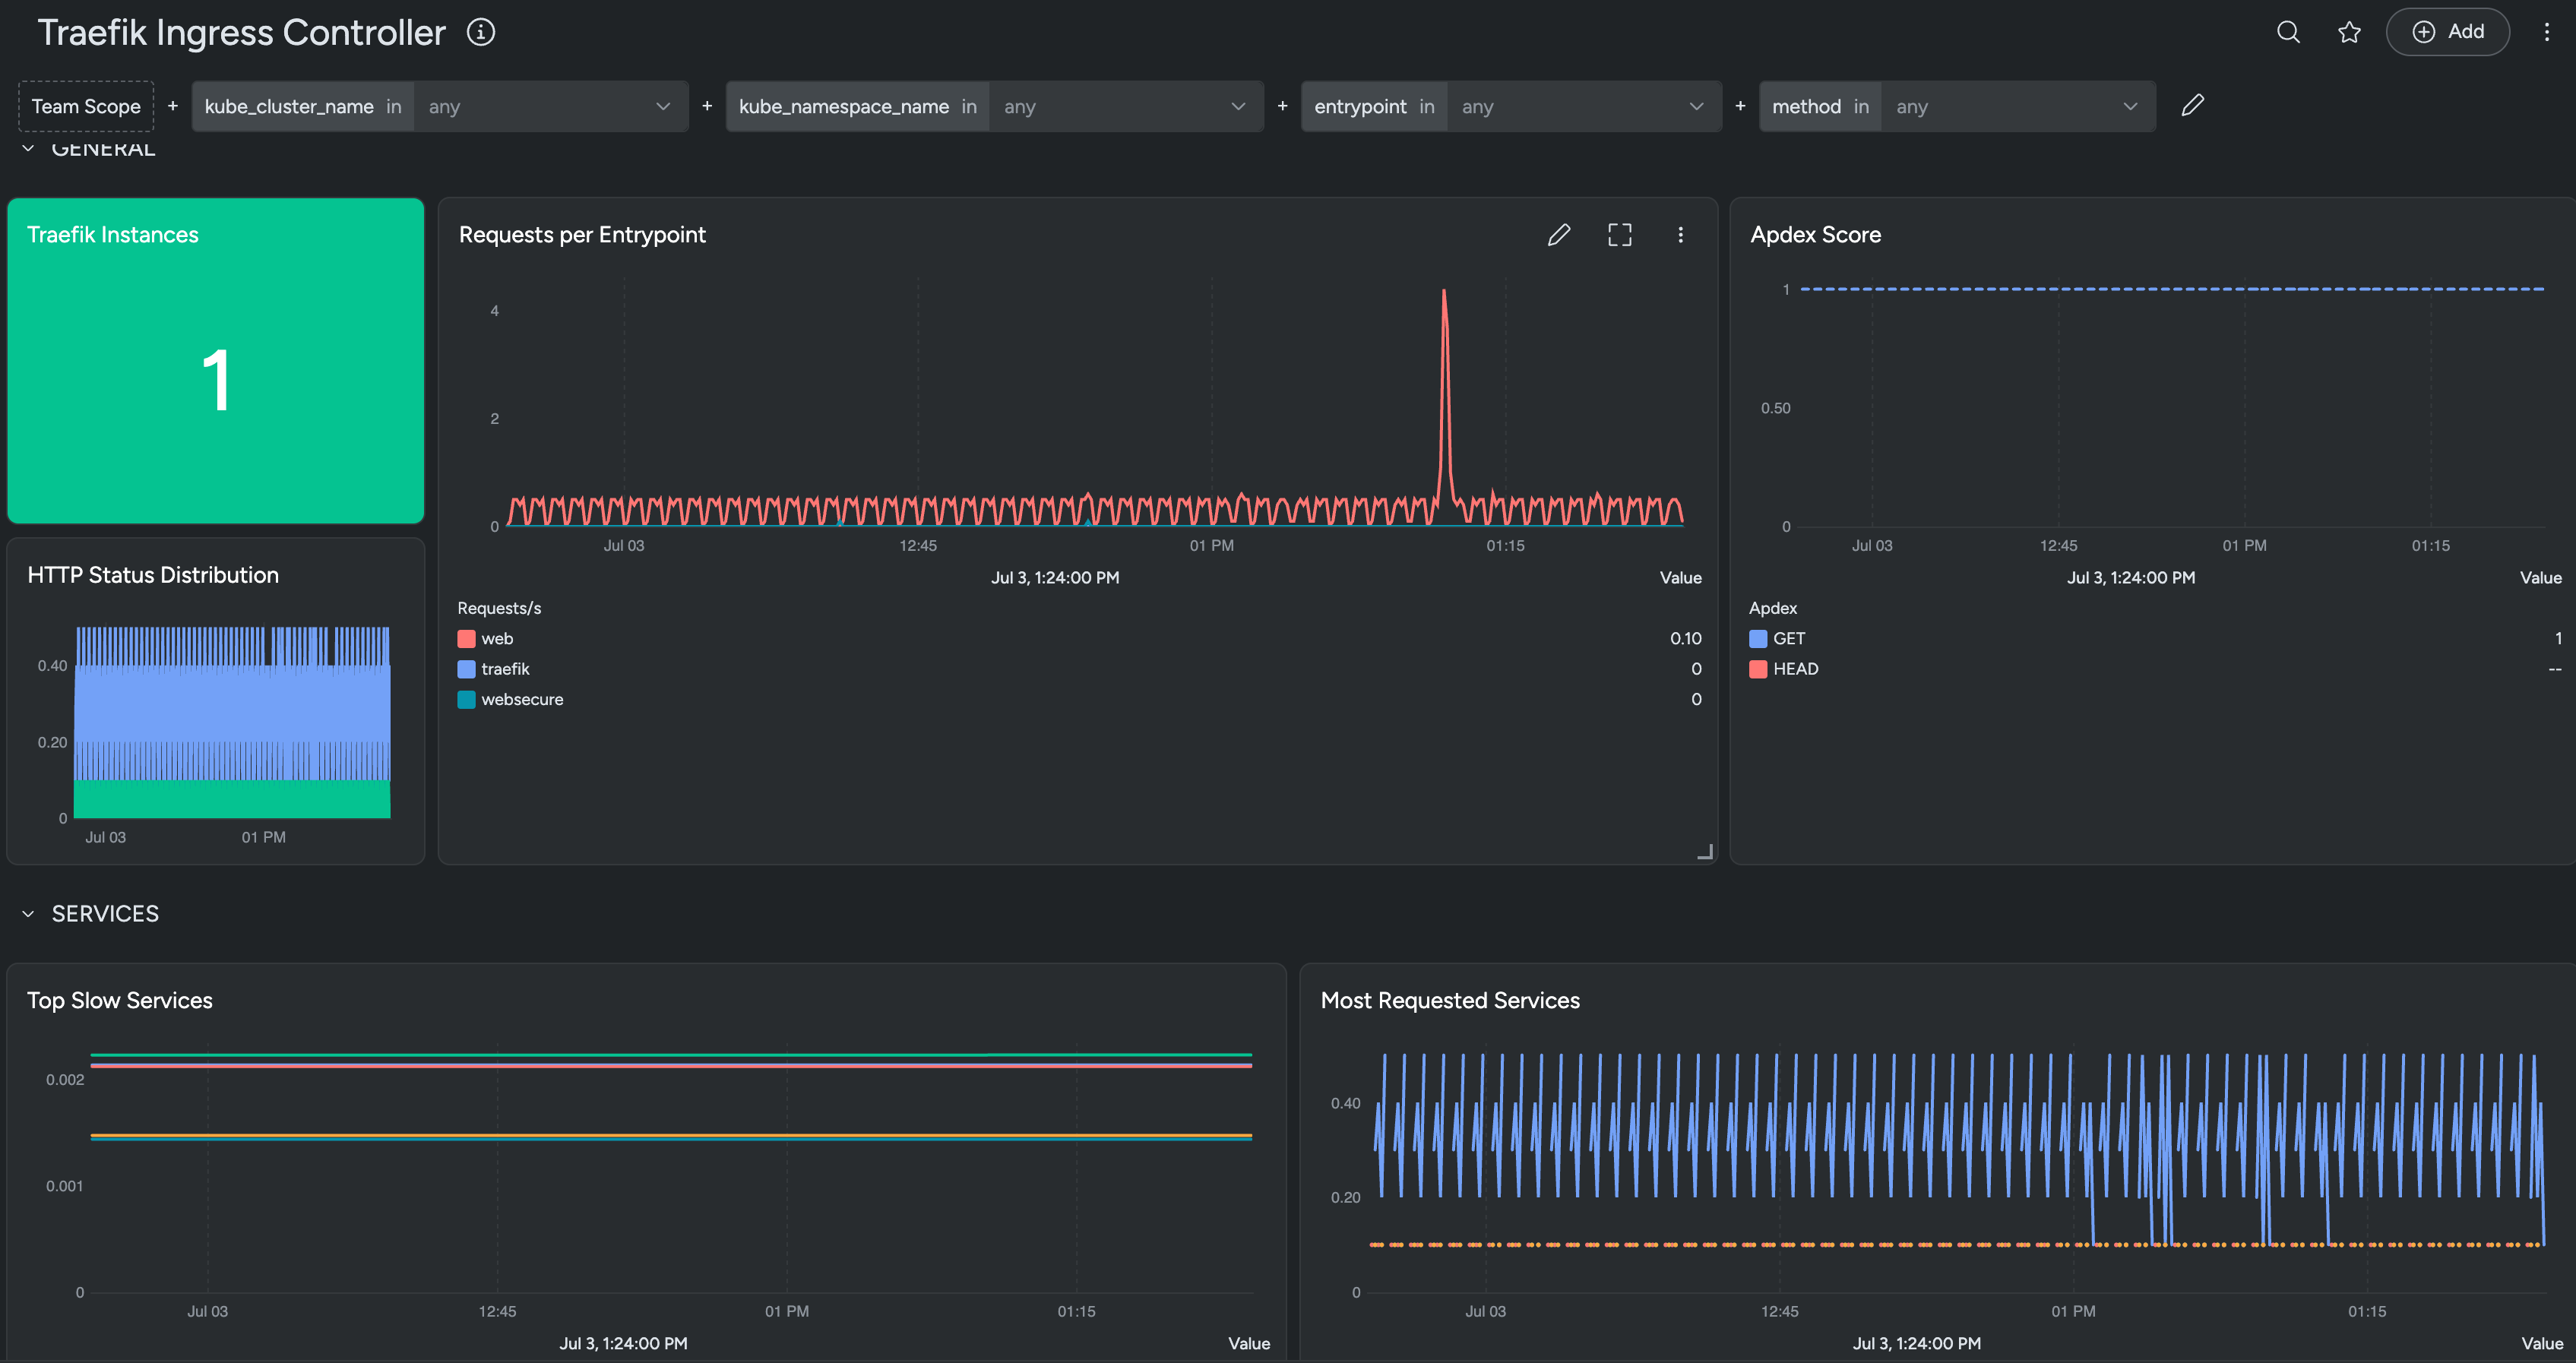
Traefik Ingress
The dashboard provides an overview of Traefik Ingress Controller traffic, latency, HTTP status codes and per-router / per-service breakdowns.
List of Metrics
| Metric name |
|---|
| go_build_info |
| go_gc_duration_seconds |
| go_gc_duration_seconds_count |
| go_gc_duration_seconds_sum |
| go_goroutines |
| go_info |
| go_memstats_buck_hash_sys_bytes |
| go_memstats_gc_sys_bytes |
| go_memstats_heap_alloc_bytes |
| go_memstats_heap_idle_bytes |
| go_memstats_heap_inuse_bytes |
| go_memstats_heap_released_bytes |
| go_memstats_heap_sys_bytes |
| go_memstats_lookups_total |
| go_memstats_mallocs_total |
| go_memstats_mcache_inuse_bytes |
| go_memstats_mcache_sys_bytes |
| go_memstats_mspan_inuse_bytes |
| go_memstats_mspan_sys_bytes |
| go_memstats_next_gc_bytes |
| go_memstats_stack_inuse_bytes |
| go_memstats_stack_sys_bytes |
| go_memstats_sys_bytes |
| go_threads |
| process_cpu_seconds_total |
| process_max_fds |
| process_open_fds |
| traefik_config_last_reload_success |
| traefik_config_reloads_total |
| traefik_entrypoint_request_duration_seconds_bucket |
| traefik_entrypoint_request_duration_seconds_count |
| traefik_entrypoint_request_duration_seconds_sum |
| traefik_entrypoint_requests_total |
| traefik_open_connections |
| traefik_router_open_connections |
| traefik_router_request_duration_seconds_count |
| traefik_router_request_duration_seconds_sum |
| traefik_router_requests_total |
| traefik_service_request_duration_seconds_bucket |
| traefik_service_request_duration_seconds_count |
| traefik_service_request_duration_seconds_sum |
| traefik_service_requests_bytes_total |
| traefik_service_requests_total |
| traefik_service_responses_bytes_total |
Prerequisites
None.
Installation
Installing an exporter is not required for this integration.
Agent Configuration
The default agent job for this integration is as follows:
- job_name: traefik-default
  kubernetes_sd_configs:
    - namespaces:
        names:
          - kube-system
      role: pod
  relabel_configs:
    - action: keep
      regex: Running
      source_labels:
        - __meta_kubernetes_pod_phase
    - action: keep
      regex: traefik
      source_labels:
        - __meta_kubernetes_pod_label_app_kubernetes_io_name
    - action: keep
      regex: traefik
      source_labels:
        - __meta_kubernetes_pod_container_name
    - action: replace
      regex: ([^:]+)(?::\d+)?;(\d+)
      replacement: $1:$2
      source_labels:
        - __address__
        - __meta_kubernetes_pod_annotation_prometheus_io_port
      target_label: __address__
    - action: replace
      regex: (.+)
      source_labels:
        - __meta_kubernetes_pod_annotation_prometheus_io_path
      target_label: __metrics_path__
    - action: replace
      source_labels:
        - __meta_kubernetes_pod_uid
      target_label: sysdig_k8s_pod_uid
    - action: replace
      source_labels:
        - __meta_kubernetes_pod_container_name
      target_label: sysdig_k8s_pod_container_name
    - action: replace
      source_labels:
        - __meta_kubernetes_namespace
      target_label: kube_namespace_name
    - action: replace
      replacement: deployment
      target_label: kube_workload_type
    - action: replace
      replacement: traefik
      target_label: kube_workload_name
  tls_config:
    insecure_skip_verify: true
