Sysdig Cluster Shield
Metrics, Dashboards, Alerts and more for Sysdig Cluster Shield Integration in Sysdig Monitor.

This integration is disabled by default. See Enable and Disable Integrations to enable it in your account.
This integration has 27 metrics.
List of Alerts
| Alert | Description | Format |
|---|---|---|
| [Sysdig Cluster Shield] Errors in Cluster Shield component | Errors in Cluster Shield component | Prometheus |
| [Sysdig Cluster Shield] Health status failed for Cluster Shield component | Health status < 1 for Cluster Shield component | Prometheus |
List of Dashboards
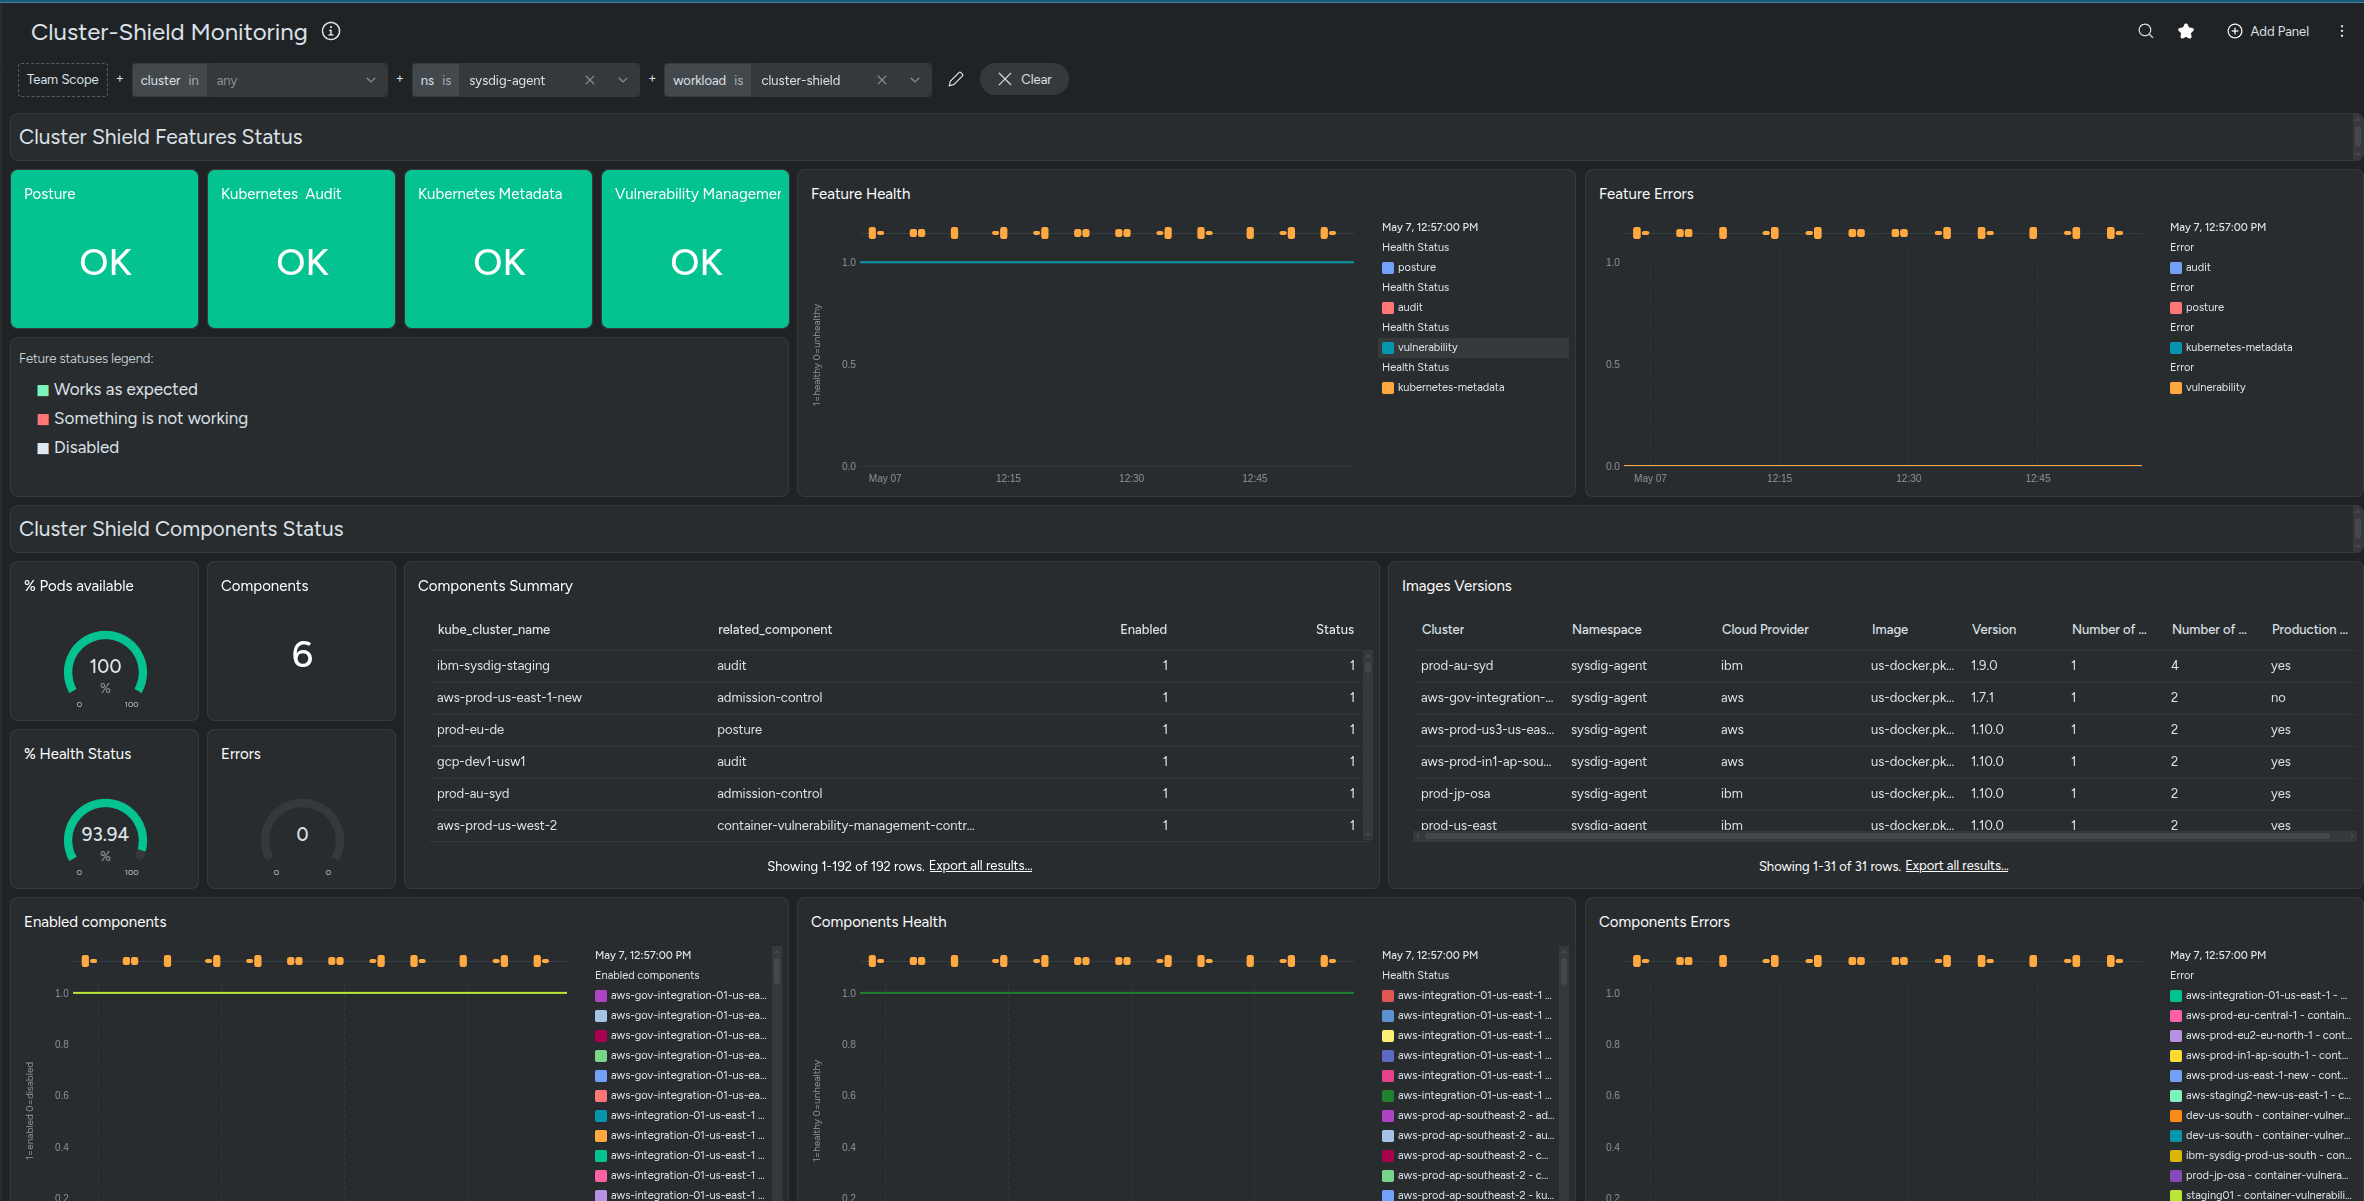
Cluster Shield
The dashboard provides information about Sysdig Cluster Shield.
List of Metrics
| Metric name |
|---|
| agent_kube_metadata_messages_sent_total |
| agent_kube_metadata_state_objects_count |
| agent_tag_prod |
| container.image |
| container.image.tag |
| k8s_audit_ac_alerts_total |
| k8s_audit_ac_events_processed_total |
| k8s_audit_ac_events_received_total |
| kube_workload_status_desired |
| kube_workload_status_ready |
| kubernetes.pod.name |
| num_of_workloads_in_SBOM_extraction_queue |
| num_of_workloads_with_SBOM_extraction_error |
| num_of_workloads_with_a_SBOM_extracted |
| num_of_workloads_without_SBOM |
| posture_k8s_api_resources_retrieved_total |
| posture_scan_completed |
| posture_scan_in_progress |
| posture_sent_result_objects |
| process_cpu_seconds_total |
| process_resident_memory_bytes |
| scanner_analyzer_cache_hit_ratio |
| scanner_analyzer_duration_seconds_count |
| scanner_loader_duration_seconds_count |
| sysdig_cluster_shield_component_enabled |
| sysdig_cluster_shield_component_health_status |
| sysdig_cluster_shield_supervisor_status_count |
Prerequisites
None.
Installation
Installing an exporter is not required for this integration.
Agent Configuration
This integration has no default agent job.
