HAProxy Ingress
This integration is enabled by default.
Versions supported: > v0.13
This integration is out-of-the-box, so it doesn’t require any exporter.
This integration has 31 metrics.
Timeseries generated: 150x number of ingress pods, 50x number of ingress pods x ingress resources
List of Alerts
| Alert | Description | Format |
|---|---|---|
| [Haproxy-Ingress] Uptime less than 1 hour | This alert detects when all of the instances of the ingress controller have an uptime of less than 1 hour. | Prometheus |
| [Haproxy-Ingress] Frontend Down | This alert detects when a frontend has all of its instances down for more than 10 minutes. | Prometheus |
| [Haproxy-Ingress] Backend Down | This alert detects when a backend has all of its instances down for more than 10 minutes. | Prometheus |
| [Haproxy-Ingress] High Sessions Usage | This alert triggers when the backend sessions overpass the 85% of the sessions capacity for 10 minutes. | Prometheus |
| [Haproxy-Ingress] High Error Rate | This alert triggers when there is an error rate over 15% for over 10 minutes in a proxy. | Prometheus |
| [Haproxy-Ingress] High Request Denied Rate | These alerts detect when there is a denied rate of requests over 10% for over 10 minutes in a proxy. | Prometheus |
| [Haproxy-Ingress] High Response Denied Rate | These alerts detect when there is a denied rate of responses over 10% for over 10 minutes in a proxy. | Prometheus |
| [Haproxy-Ingress] High Response Rate | This alert triggers when a proxy has a mean response time higher than 250ms for over 10 minutes. | Prometheus |
List of Dashboards
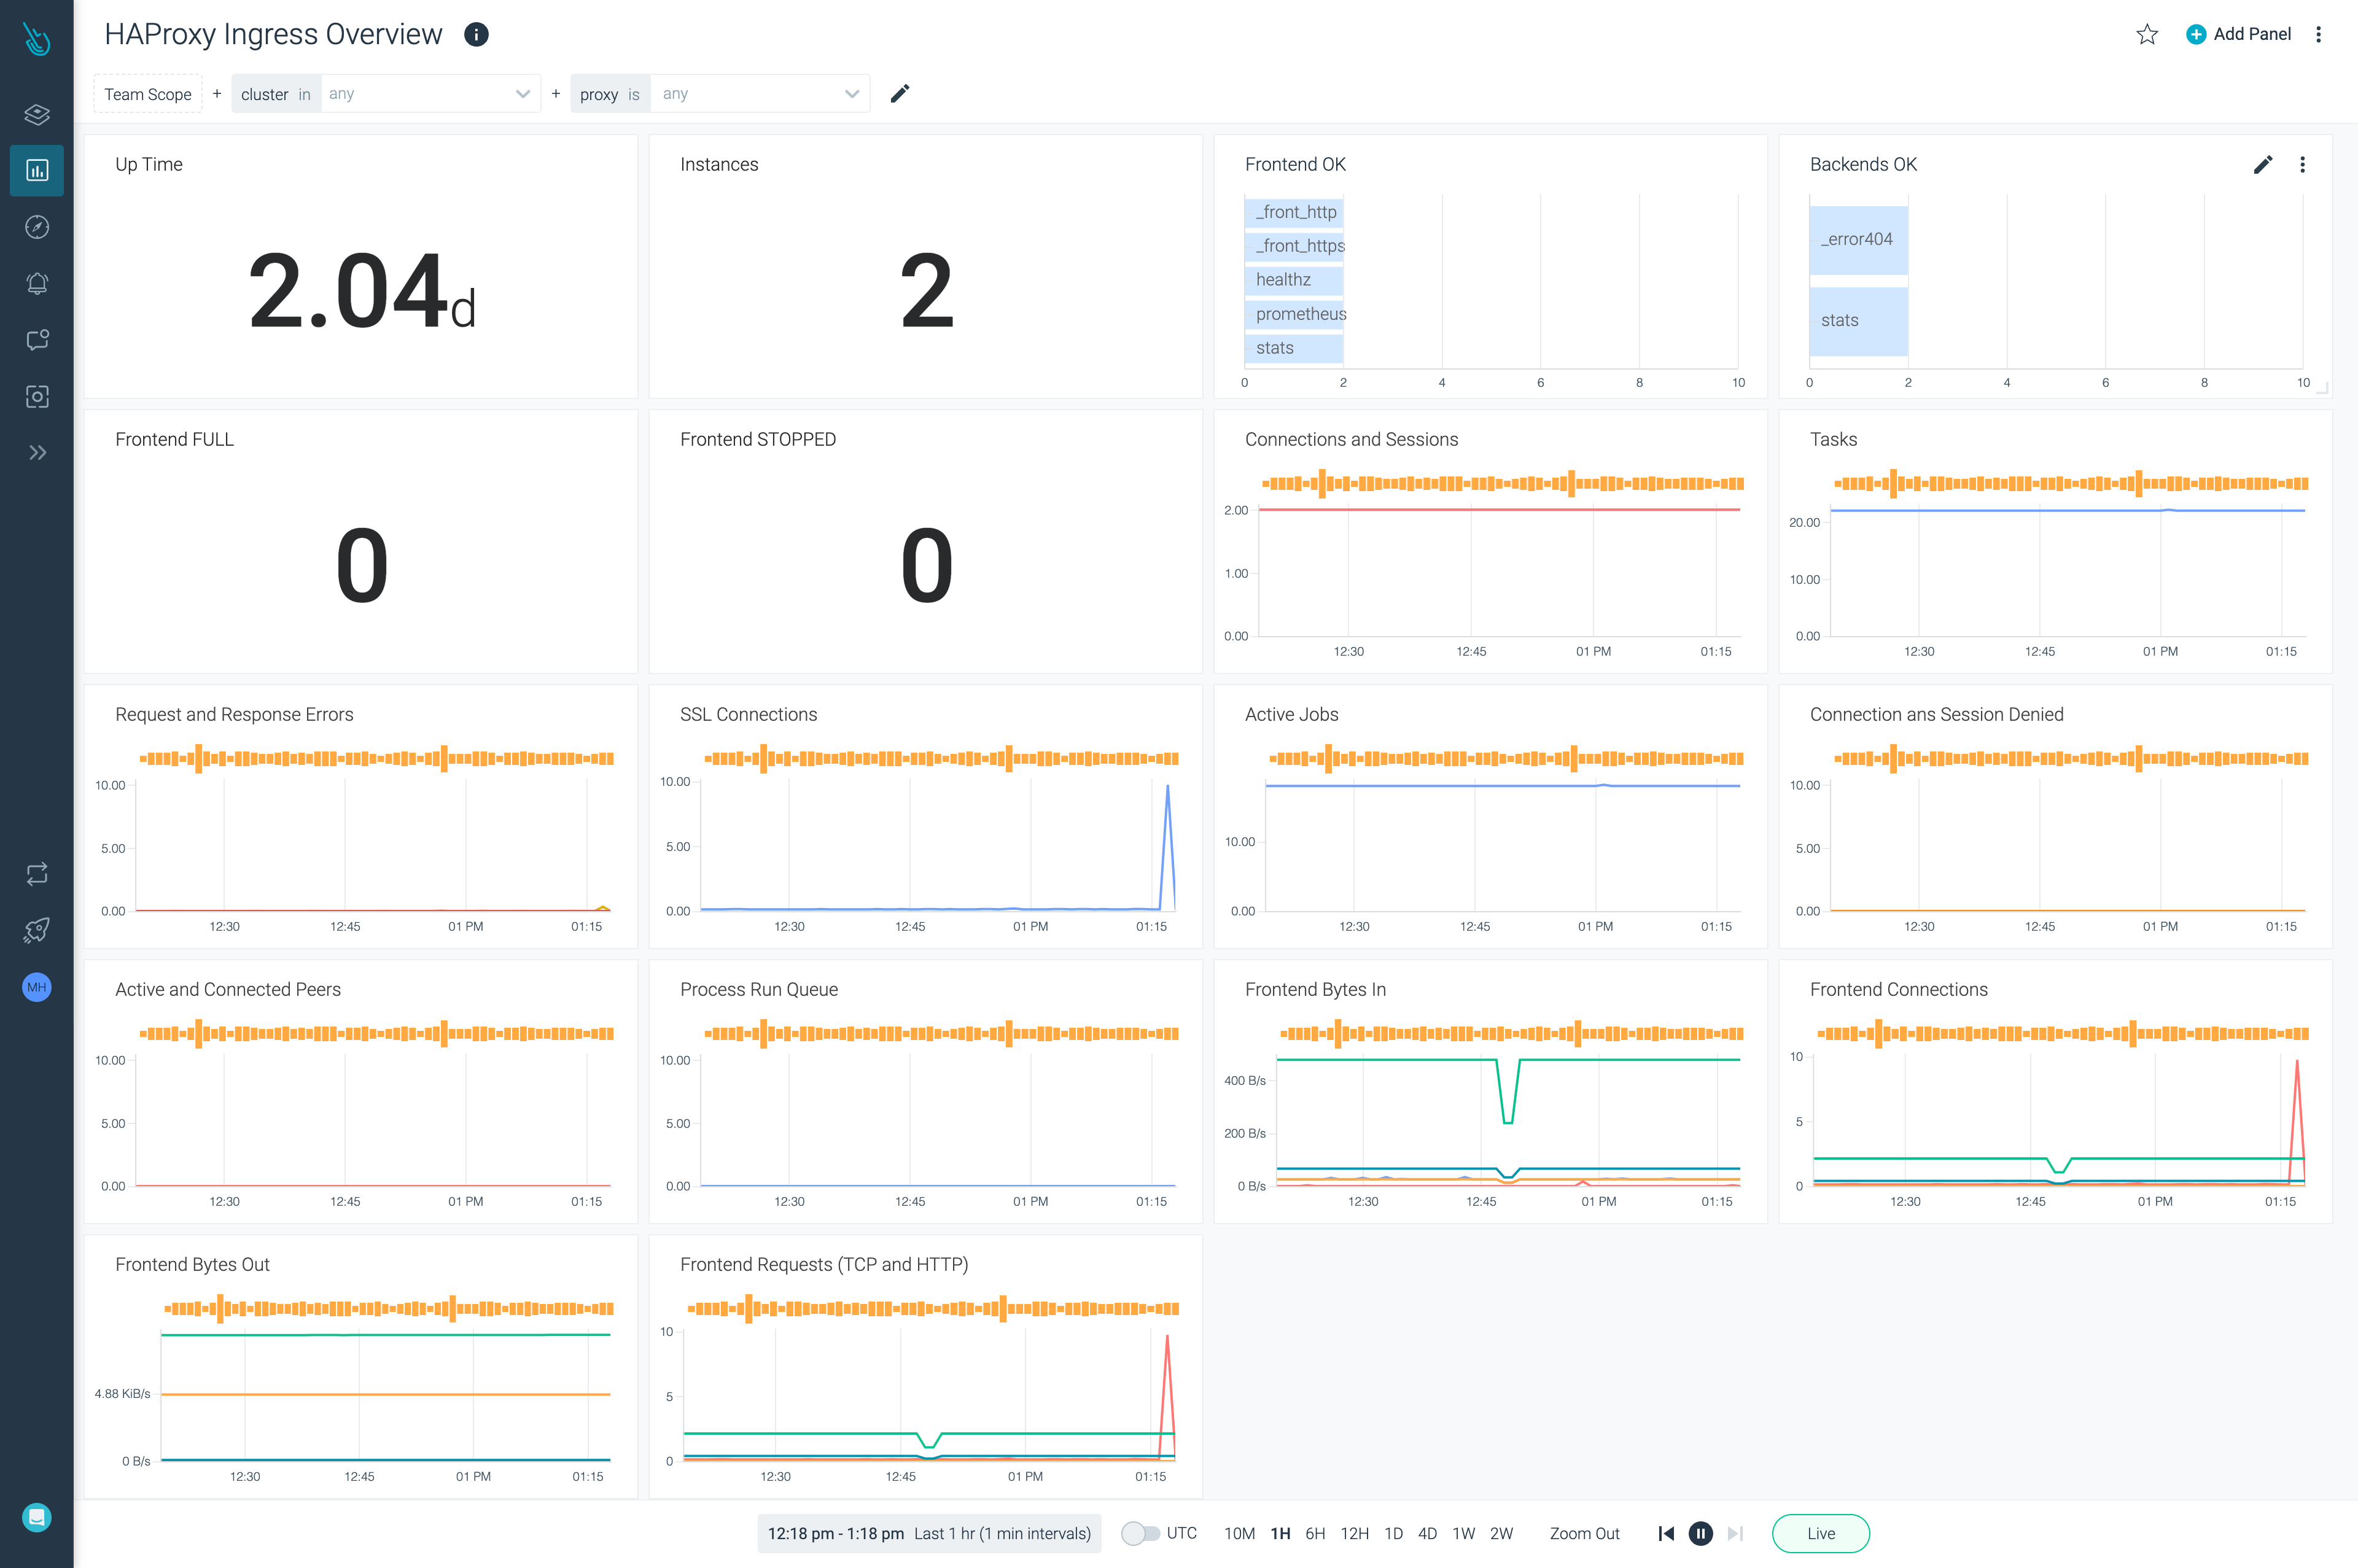
HAProxy Ingress Overview
The dashboard provides information on the HAProxy Ingress Overview.

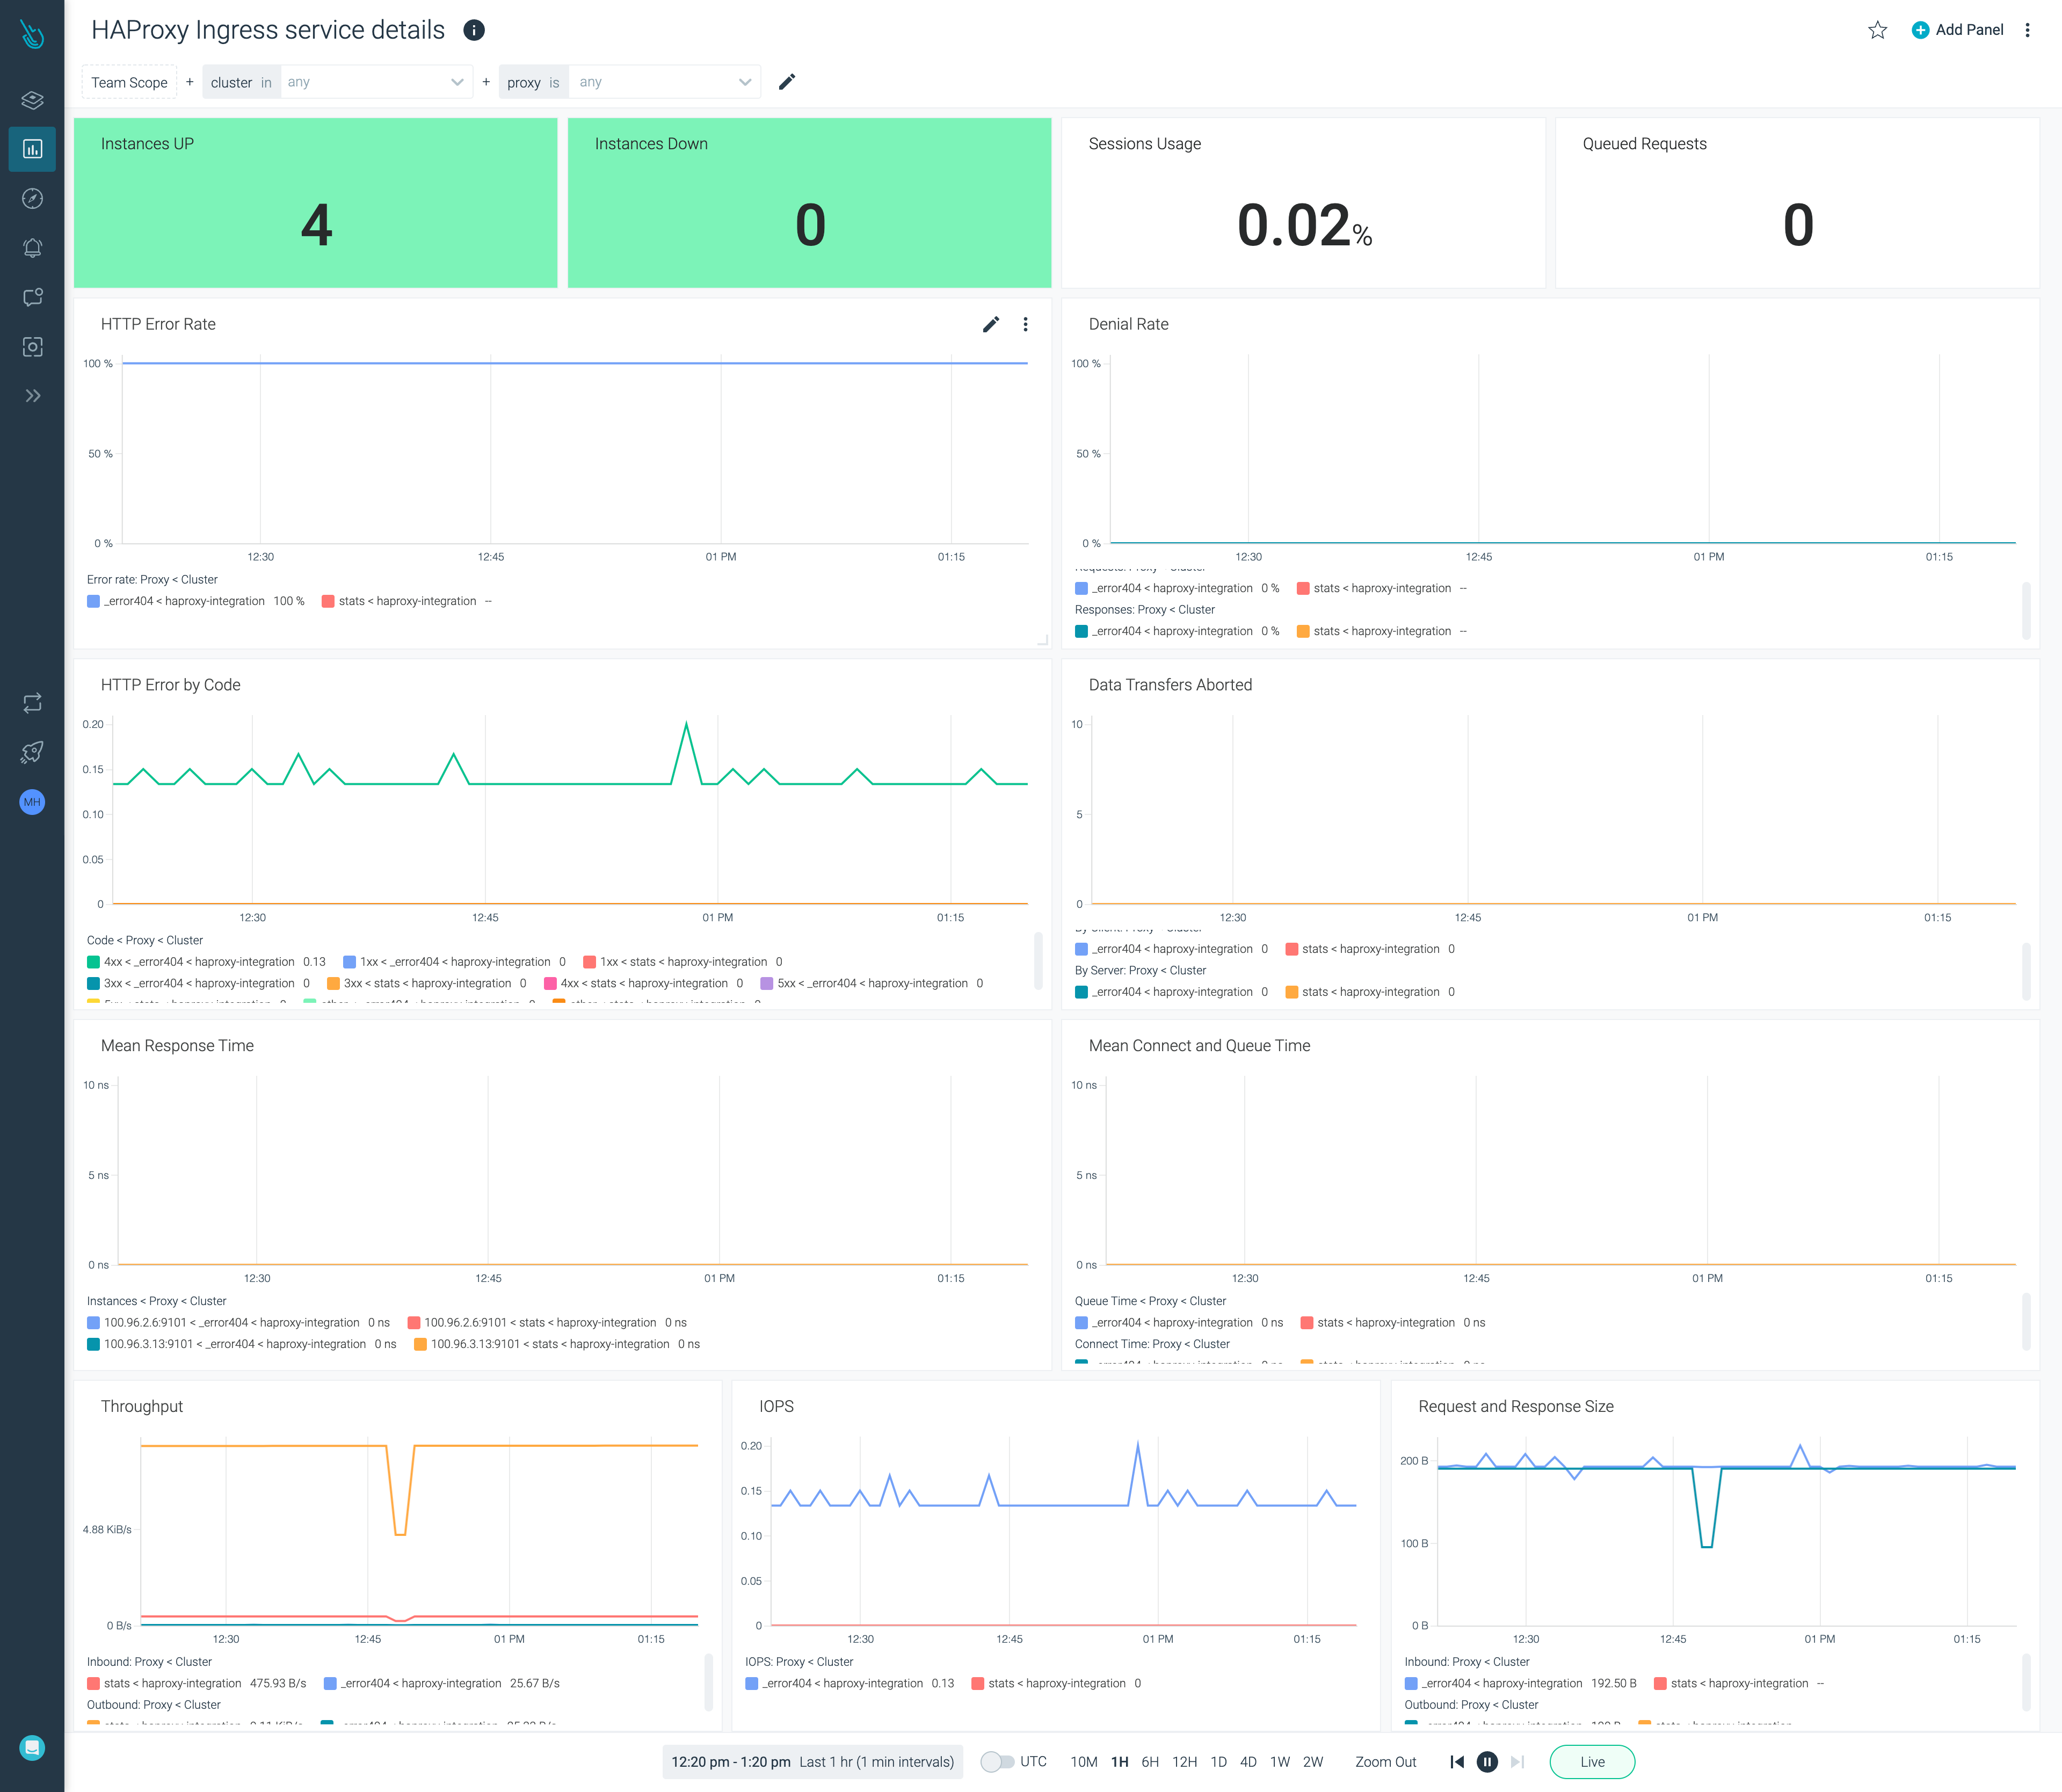
HAProxy Ingress Service Details
The dashboard provides information on the HAProxy Ingress Service Details.

List of Metrics
| Metric name |
|---|
| haproxy_backend_bytes_in_total |
| haproxy_backend_bytes_out_total |
| haproxy_backend_client_aborts_total |
| haproxy_backend_connect_time_average_seconds |
| haproxy_backend_current_queue |
| haproxy_backend_http_requests_total |
| haproxy_backend_http_responses_total |
| haproxy_backend_limit_sessions |
| haproxy_backend_queue_time_average_seconds |
| haproxy_backend_requests_denied_total |
| haproxy_backend_response_time_average_seconds |
| haproxy_backend_responses_denied_total |
| haproxy_backend_sessions_total |
| haproxy_backend_status |
| haproxy_frontend_bytes_in_total |
| haproxy_frontend_bytes_out_total |
| haproxy_frontend_connections_total |
| haproxy_frontend_denied_connections_total |
| haproxy_frontend_denied_sessions_total |
| haproxy_frontend_request_errors_total |
| haproxy_frontend_requests_denied_total |
| haproxy_frontend_responses_denied_total |
| haproxy_frontend_status |
| haproxy_process_active_peers |
| haproxy_process_current_connection_rate |
| haproxy_process_current_run_queue |
| haproxy_process_current_session_rate |
| haproxy_process_current_tasks |
| haproxy_process_jobs |
| haproxy_process_ssl_connections_total |
| haproxy_process_start_time_seconds |
Prerequisites
Enable Prometheus Metrics
For HAProxy to expose Prometheus metrics, the following options must be enabled:
- controller.metrics.enabled = true
- controller.stats.enabled = true
You can check all the properties in the official web page.
If you are deploying HAProxy using the official Helm chart, they can be enabled with the following configurations:
helm install haproxy-ingress haproxy-ingress/haproxy-ingress \
--set-string "controller.stats.enabled = true" \
--set-string "controller.metrics.enabled = true"
This configuration creates the following section in haproxy.cfg file
frontend prometheus
    mode http
    bind :9101
    http-request use-service prometheus-exporter if { path /metrics }
    http-request use-service lua.send-prometheus-root if { path / }
    http-request use-service lua.send-404
    no log
Installation
Installing an exporter is not required for this integration.
Agent Configuration
The default agent job for this integration is as follows:
- job_name: 'haproxy-default'
  tls_config:
    insecure_skip_verify: true
  kubernetes_sd_configs:
  - role: pod
  relabel_configs:
  - action: keep
    source_labels: [__meta_kubernetes_pod_host_ip]
    regex: __HOSTIPS__
  - action: drop
    source_labels: [__meta_kubernetes_pod_annotation_promcat_sysdig_com_omit]
    regex: true
  - source_labels: [__meta_kubernetes_pod_phase]
    action: keep
    regex: Running
  - action: replace
    source_labels: [__meta_kubernetes_pod_annotation_prometheus_io_scheme]
    target_label: __scheme__
    regex: (https?)
  - action: replace
    source_labels:
    - __meta_kubernetes_pod_container_name
    - __meta_kubernetes_pod_annotation_promcat_sysdig_com_integration_type
    regex: (haproxy-ingress);(.{0}$)
    replacement: haproxy-ingress
    target_label: __meta_kubernetes_pod_annotation_promcat_sysdig_com_integration_type
  - action: keep
    source_labels:
    - __meta_kubernetes_pod_annotation_promcat_sysdig_com_integration_type
    regex: "haproxy-ingress"
  - action: replace
    source_labels: [__meta_kubernetes_pod_uid]
    target_label: sysdig_k8s_pod_uid
  - action: replace
    source_labels: [__meta_kubernetes_pod_container_name]
    target_label: sysdig_k8s_pod_container_name
  metric_relabel_configs:
  - source_labels: [__name__]
    regex: (haproxy_backend_bytes_in_total|haproxy_backend_bytes_out_total|haproxy_backend_client_aborts_total|haproxy_backend_connect_time_average_seconds|haproxy_backend_current_queue|haproxy_backend_http_requests_total|haproxy_backend_http_responses_total|haproxy_backend_limit_sessions|haproxy_backend_queue_time_average_seconds|haproxy_backend_requests_denied_total|haproxy_backend_response_time_average_seconds|haproxy_backend_responses_denied_total|haproxy_backend_sessions_total|haproxy_backend_status|haproxy_frontend_bytes_in_total|haproxy_frontend_bytes_out_total|haproxy_frontend_connections_total|haproxy_frontend_denied_connections_total|haproxy_frontend_denied_sessions_total|haproxy_frontend_request_errors_total|haproxy_frontend_requests_denied_total|haproxy_frontend_responses_denied_total|haproxy_frontend_status|haproxy_process_active_peers|haproxy_process_current_connection_rate|haproxy_process_current_run_queue|haproxy_process_current_session_rate|haproxy_process_current_tasks|haproxy_process_jobs|haproxy_process_ssl_connections_total|haproxy_process_start_time_seconds)
    action: keep
Feedback
Was this page helpful?
Glad to hear it! Please tell us how we can improve.
Sorry to hear that. Please tell us how we can improve.