KubeVirt
Metrics, Dashboards, Alerts and more for KubeVirt Integration in Sysdig Monitor.

This integration is enabled by default.
This integration is out-of-the-box, so it doesn’t require any exporter.
This integration has 31 metrics.
List of Alerts
| Alert | Description | Format |
|---|---|---|
| [KubeVirt] Virtual Machine Instances Not Running | Virtual Machine Instances are not running | Prometheus |
| [KubeVirt] High vCPU Wait Time | vCPU delay is too high | Prometheus |
| [KubeVirt] Memory Pressure Low Available Memory | Available memory is below 15% | Prometheus |
| [KubeVirt] High Network Error Rate | Network error rate is above 1% | Prometheus |
| [KubeVirt] Storage I/O Latency High | Average storage I/O latency is above 50ms | Prometheus |
List of Dashboards
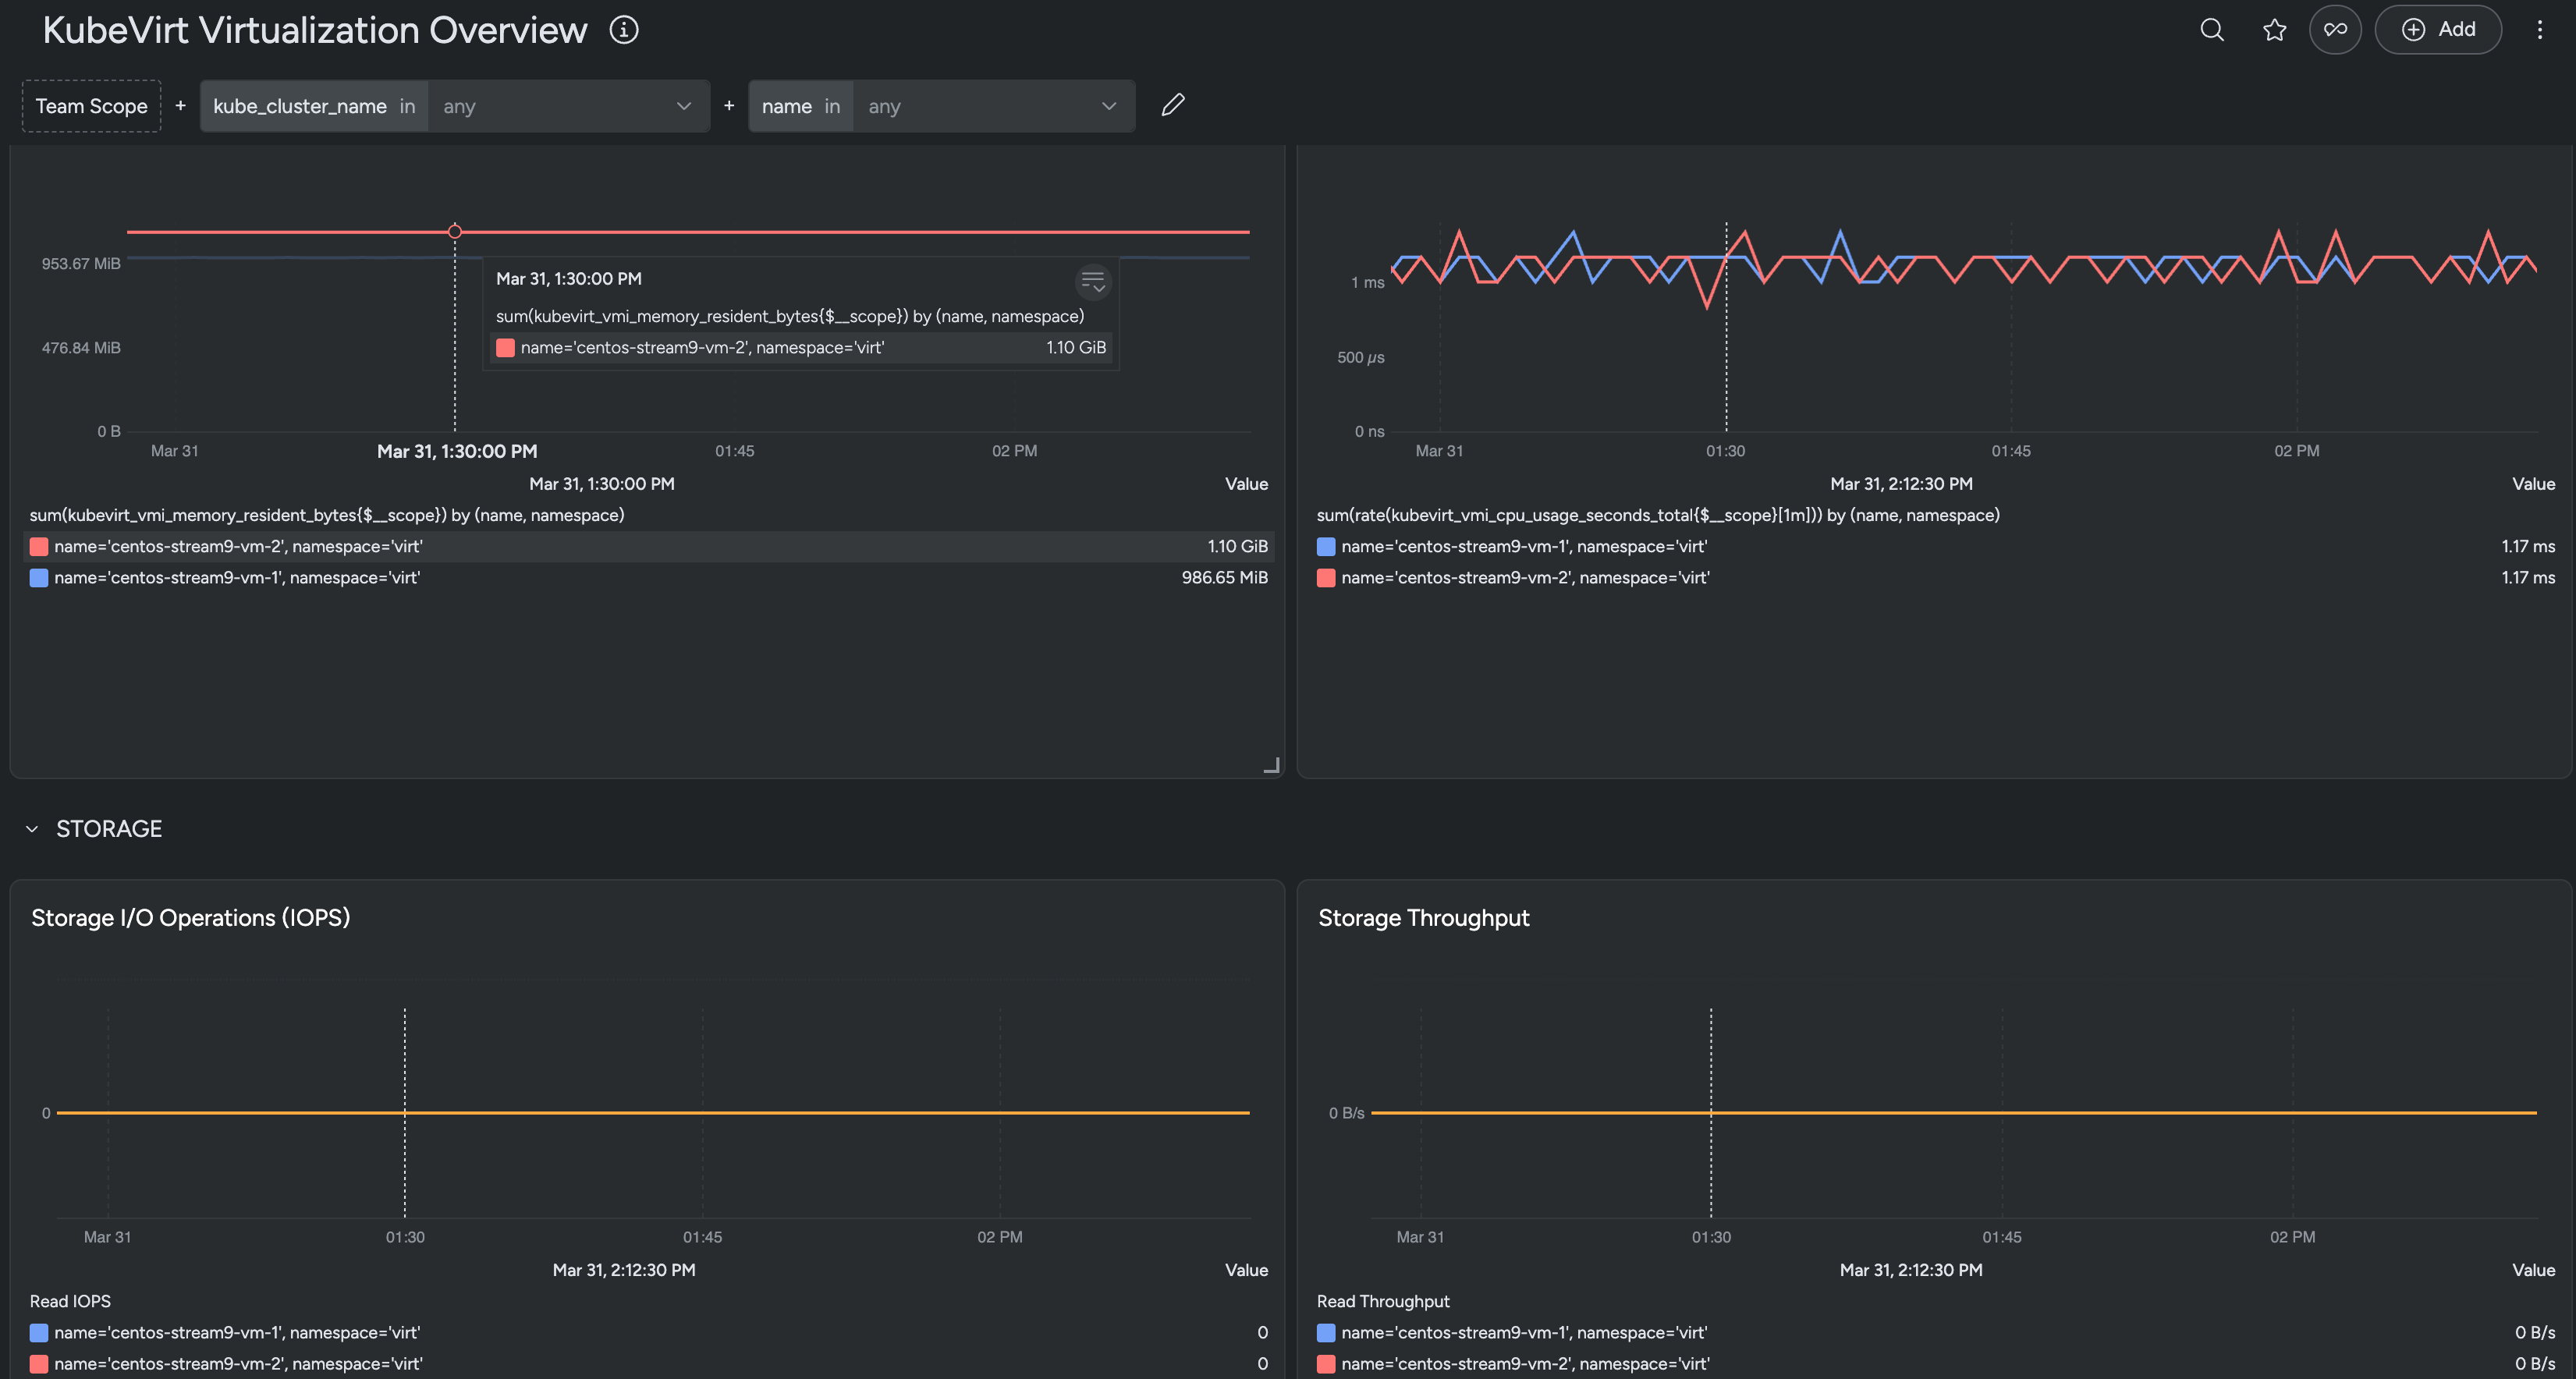
KubeVirt Virtualization Overview
The dashboard provides information on the status and resource consumption of KubeVirt virtual machines.
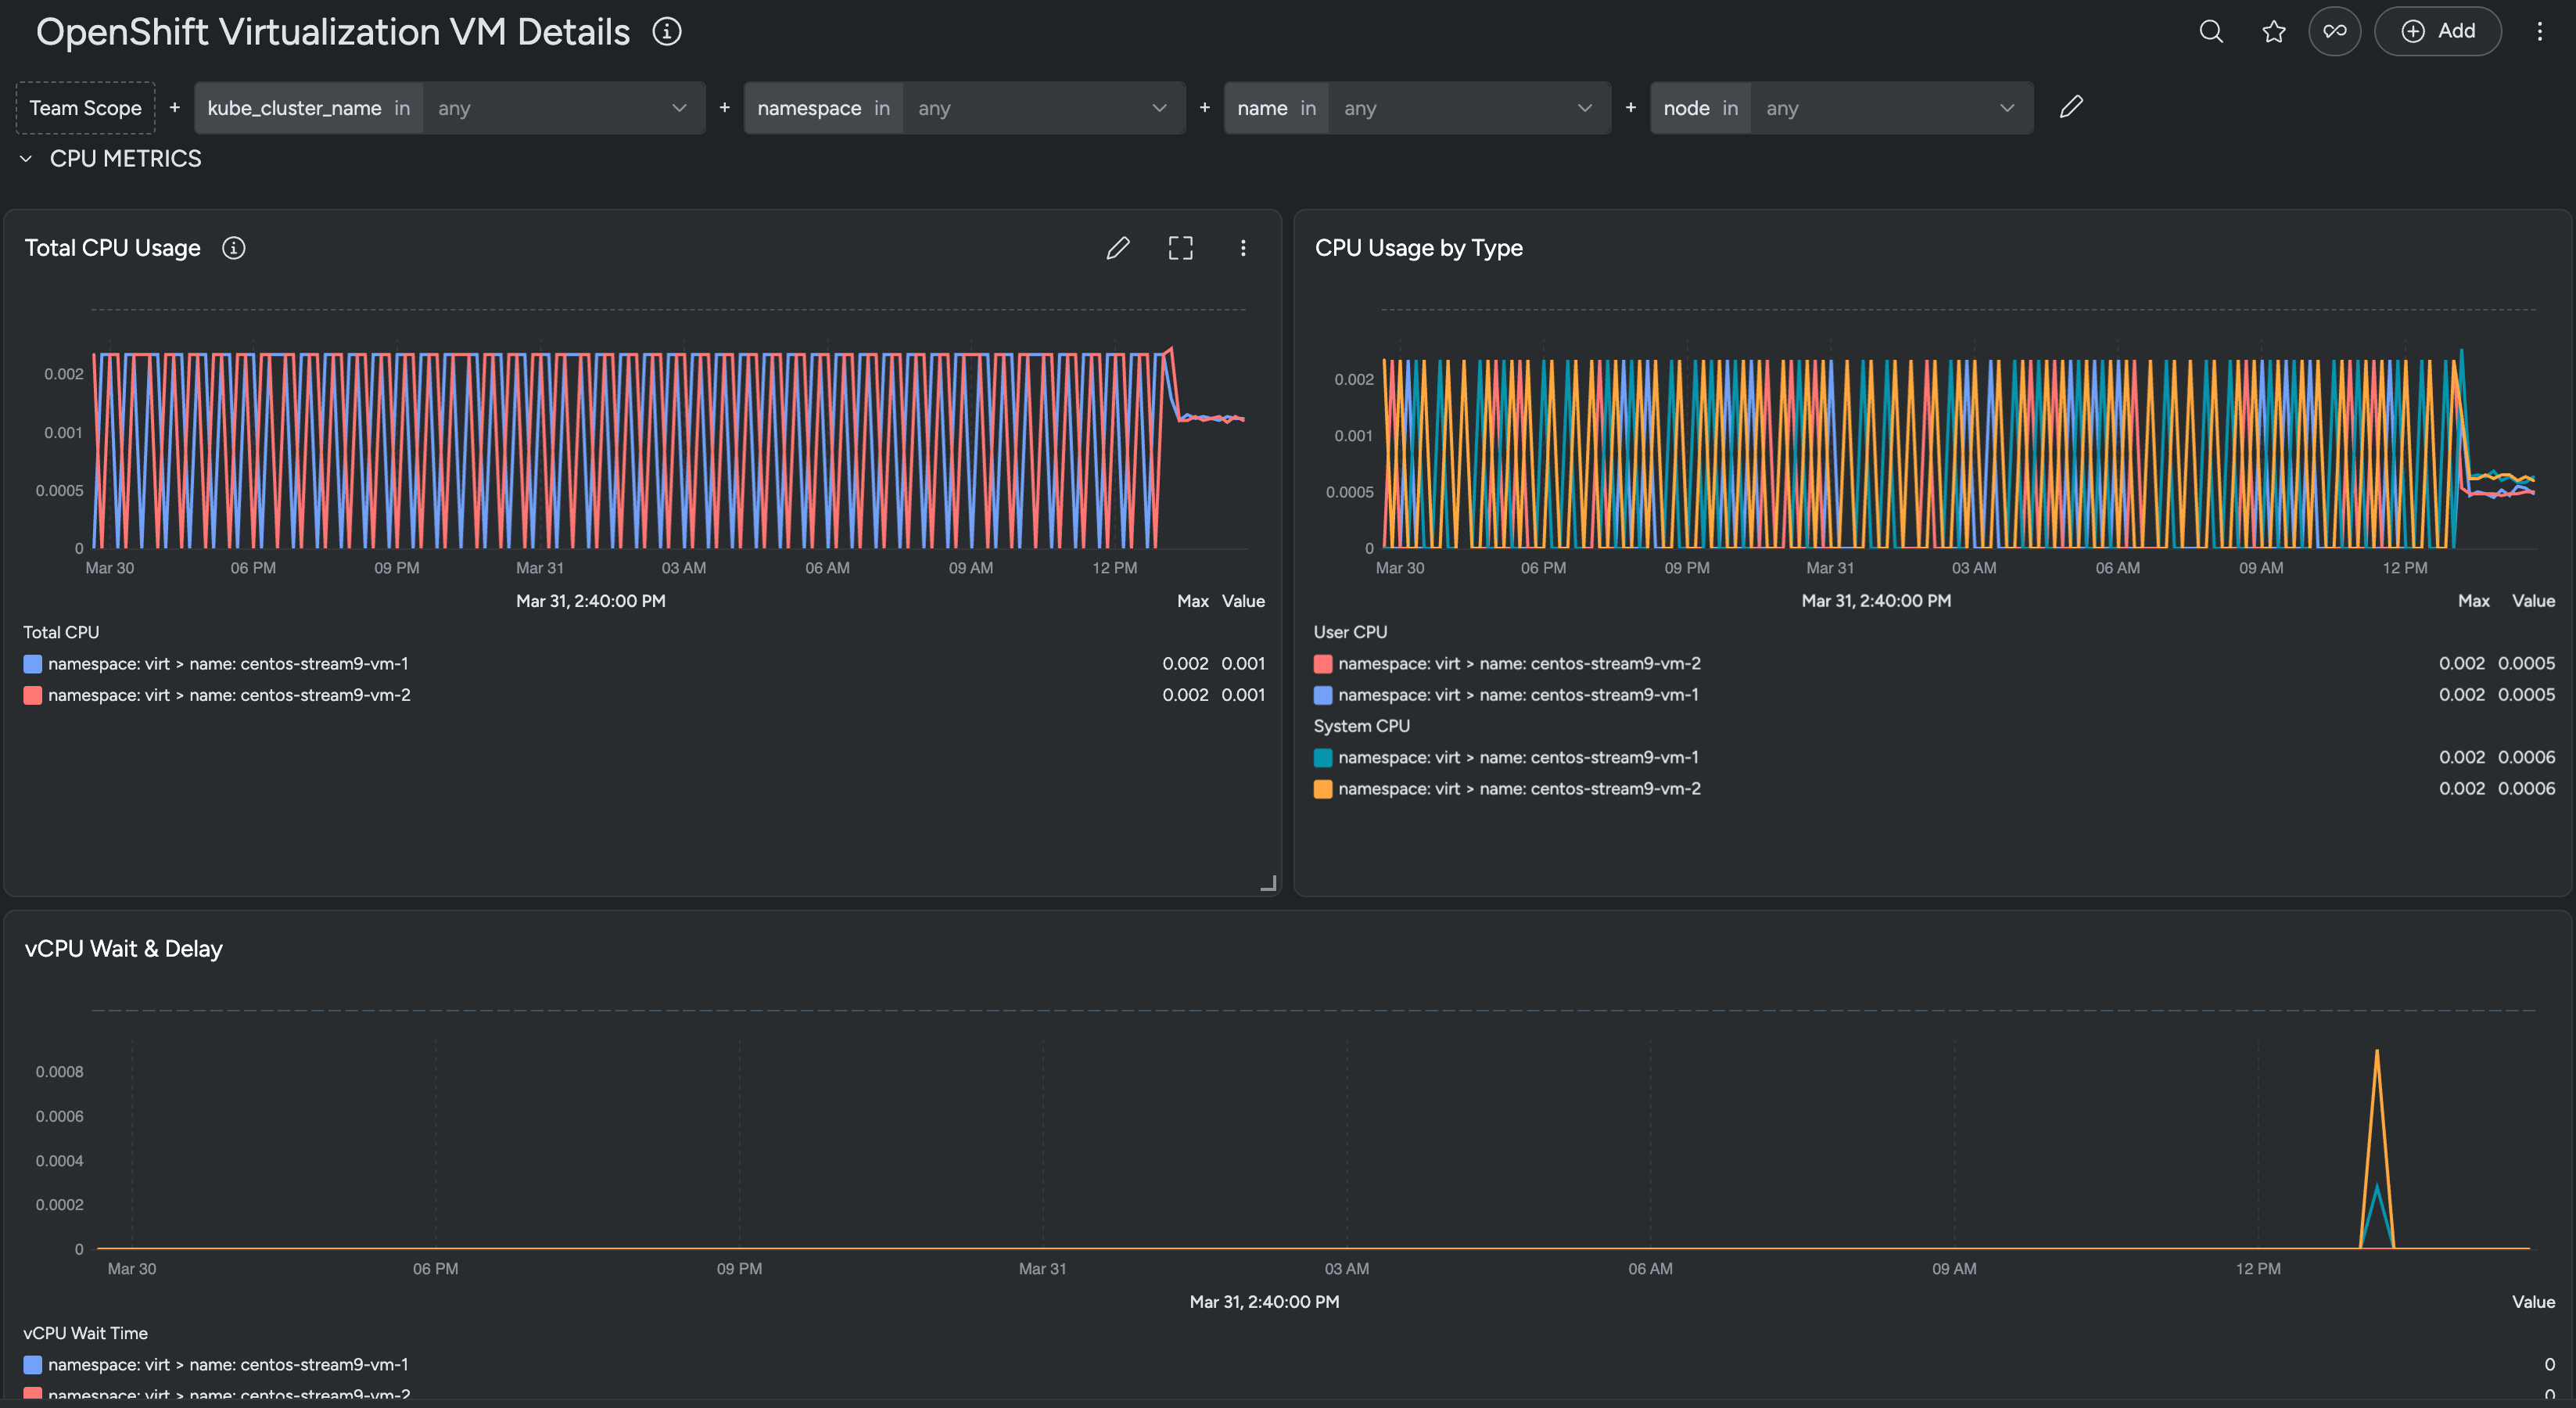
OpenShift Virtualization VM Details
The dashboard provides information on the details of OpenShift VMs.
List of Metrics
| Metric name |
|---|
| kubevirt_info |
| kubevirt_vm_info |
| kubevirt_vmi_cpu_system_usage_seconds_total |
| kubevirt_vmi_cpu_usage_seconds_total |
| kubevirt_vmi_cpu_user_usage_seconds_total |
| kubevirt_vmi_filesystem_capacity_bytes |
| kubevirt_vmi_filesystem_used_bytes |
| kubevirt_vmi_info |
| kubevirt_vmi_memory_available_bytes |
| kubevirt_vmi_memory_cached_bytes |
| kubevirt_vmi_memory_domain_bytes |
| kubevirt_vmi_memory_pgmajfault_total |
| kubevirt_vmi_memory_pgminfault_total |
| kubevirt_vmi_memory_resident_bytes |
| kubevirt_vmi_memory_unused_bytes |
| kubevirt_vmi_network_receive_bytes_total |
| kubevirt_vmi_network_receive_errors_total |
| kubevirt_vmi_network_receive_packets_dropped_total |
| kubevirt_vmi_network_receive_packets_total |
| kubevirt_vmi_network_transmit_bytes_total |
| kubevirt_vmi_network_transmit_errors_total |
| kubevirt_vmi_network_transmit_packets_dropped_total |
| kubevirt_vmi_network_transmit_packets_total |
| kubevirt_vmi_storage_iops_read_total |
| kubevirt_vmi_storage_iops_write_total |
| kubevirt_vmi_storage_read_times_seconds_total |
| kubevirt_vmi_storage_read_traffic_bytes_total |
| kubevirt_vmi_storage_write_times_seconds_total |
| kubevirt_vmi_storage_write_traffic_bytes_total |
| kubevirt_vmi_vcpu_delay_seconds_total |
| kubevirt_vmi_vcpu_wait_seconds_total |
Prerequisites
None.
Installation
Installing an exporter is not required for this integration.
Agent Configuration
The default agent job for this integration is as follows:
- job_name: "kubevirt-metrics"
  scrape_interval: 30s
  scheme: https
  tls_config:
    insecure_skip_verify: true
  bearer_token_file: /var/run/secrets/kubernetes.io/serviceaccount/token

  kubernetes_sd_configs:
    - role: pod

  relabel_configs:
    - action: keep
      source_labels: [__meta_kubernetes_pod_host_ip]
      regex: __HOSTIPS__

    - action: keep
      source_labels: [__meta_kubernetes_pod_label_prometheus_kubevirt_io]
      regex: true

    - action: replace
      source_labels: [__meta_kubernetes_pod_name]
      target_label: kube_pod_name

    - action: replace
      source_labels: [__meta_kubernetes_pod_uid]
      target_label: sysdig_k8s_pod_uid

    - action: replace
      source_labels: [__meta_kubernetes_pod_container_name]
      target_label: sysdig_k8s_pod_container_name

    - source_labels: [__meta_kubernetes_pod_container_port_name]
      action: keep
      regex: "metrics"

  metric_relabel_configs:
    # Drop the kubevirt REST client histograms. They are high-cardinality
    # (hundreds of series per virt-* pod) and are not used by any KubeVirt
    # dashboard or alert. On busy nodes they consume the agent's Prometheus
    # metric budget and can cause the per-VMI metrics (kubevirt_vmi_*) from
    # the local virt-handler to be dropped, leaving the dashboards empty.
    - action: drop
      source_labels: [__name__]
      regex: "kubevirt_rest_client_.*"
