OpenShift State Metrics
This integration is enabled by default.
Versions supported: > v4.7
This integration is out-of-the-box, so it doesn’t require any exporter.
This integration has 4 metrics.
Timeseries generated: 30 timeseries + 4 series per route
List of Alerts
| Alert | Description | Format |
|---|---|---|
| [OpenShift-state-metrics] CPU Resource Request Quota Usage | Resource request CPU usage is over 90% resource quota. | Prometheus |
| [OpenShift-state-metrics] CPU Resource Limit Quota Usage | Resource limit CPU usage is over 90% resource limit quota. | Prometheus |
| [OpenShift-state-metrics] Memory Resource Request Quota Usage | Resource request memory usage is over 90% resource quota. | Prometheus |
| [OpenShift-state-metrics] Memory Resource Limit Quota Usage | Resource limit memory usage is over 90% resource limit quota. | Prometheus |
| [OpenShift-state-metrics] Routes with issues | A route status is in error and is having issues. | Prometheus |
| [OpenShift-state-metrics] Buid Processes with issues | A build process is in error or failed status. | Prometheus |
List of Dashboards
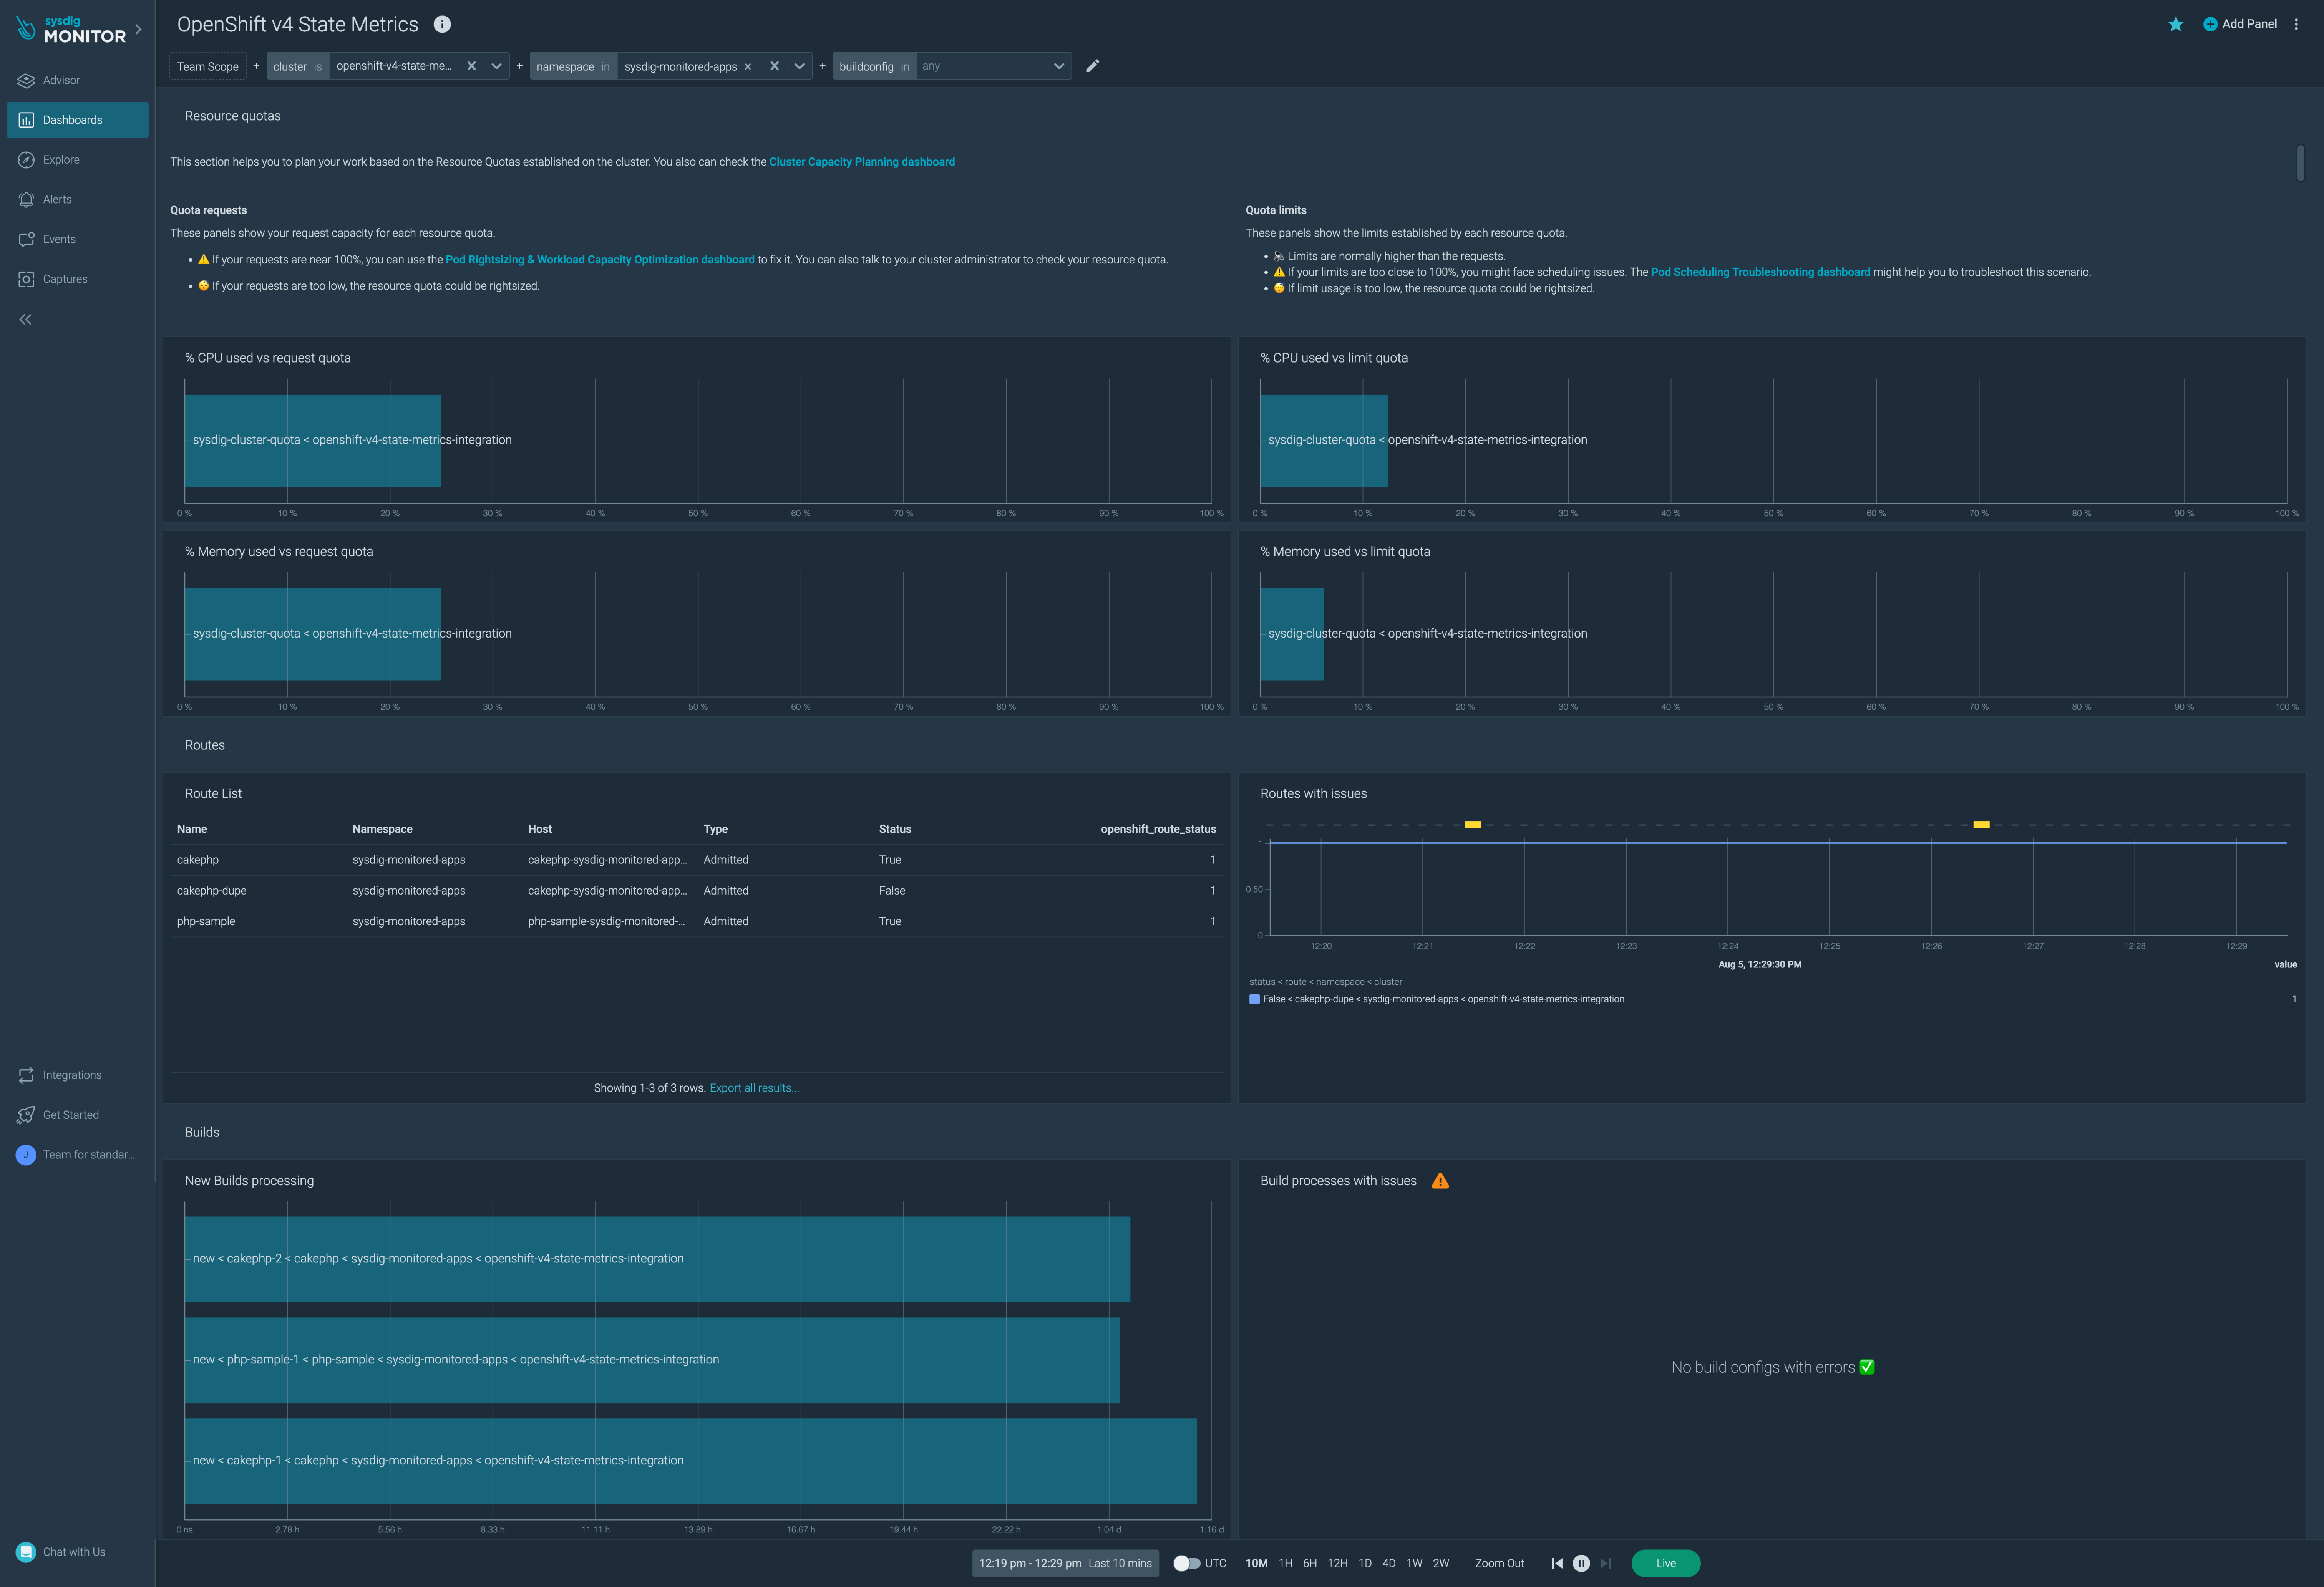
OpenShift v4 State Metrics
If you are using Prometheus Remote Write you will need to add the following metric relabel config for this label.
    - action: replace
    source_labels: [ __address__ ]
    target_label: _sysdig_integration_openshift_state_metrics
    replacement: true
The dashboard provides information on the special OpenShift-state-metrics.

List of Metrics
| Metric name |
|---|
| openshift_build_created_timestamp_seconds |
| openshift_build_status_phase_total |
| openshift_clusterresourcequota_usage |
| openshift_route_status |
Prerequisites
None.
Installation
Installing an exporter is not required for this integration.
Monitoring and Troubleshooting OpenShift State Metrics
No further installation is needed, since OKD4 comes with both Prometheus and OSM ready to use.
Here are some interesting metrics and queries to monitor and troubleshoot OpenShift 4.
Resource Quotas
Resource Quotas Requests
% CPU Used vs Request Quota
Let’s get what’s the % of CPU used vs the request quota.
sum by (name, kube_cluster_name) (openshift_clusterresourcequota_usage{resource="requests.cpu", type="used"}) / sum by (name, kube_cluster_name) (openshift_clusterresourcequota_usage{resource="requests.cpu", type="hard"}) > 0
% Memory Used vs Request Quota
Now, the same but for the memory.
sum by (name, kube_cluster_name)(openshift_clusterresourcequota_usage{resource="requests.memory", type="used"}) / sum by (name, kube_cluster_name)(openshift_clusterresourcequota_usage{resource="requests.memory", type="hard"}) > 0
These queries return one time series for each resource quota deployed in the cluster.
Please, not that if your requests are near 100%, you can use the Pod Rightsizing & Workload Capacity Optimization dashboard to fix it. You can also talk to your cluster administrator to check your resource quota. Also, if your requests are too low, the resource quota could be rightsized.
Resource Quotas Limits
% CPU Used vs Limit Quota
Let’s get what’s the % of CPU used vs the limit quota.
sum by (name, kube_cluster_name)(openshift_clusterresourcequota_usage{resource="limits.cpu", type="used"}) / sum by (name, kube_cluster_name)(openshift_clusterresourcequota_usage{resource="limits.cpu", type="hard"}) > 0
% Memory Used vs Limit Quota
Now, the same but for the memory.
sum by (name, kube_cluster_name)(openshift_clusterresourcequota_usage{resource="limits.memory", type="used"}) / sum by (name, kube_cluster_name)(openshift_clusterresourcequota_usage{resource="limits.memory", type="hard"}) > 0
These queries return one time series for each resource quota deployed in the cluster.
Please, note that quota limits are normally higher than the quota requests. If your limits are too close to 100%, you might face scheduling issues. The Pod Scheduling Troubleshooting dashboard might help you to troubleshoot this scenario. Also, if limit usage is too low, the resource quota could be rightsized.
Routes
List the Routes
Let’s get a list of all the routes present in the cluster, aggregated by host and namespace
sum by (route, host, namespace) (openshift_route_info)
Duplicated Routes
Now, let’s find our duplicated routes:
sum by (host) (openshift_route_info) > 1
This query will return the duplicated hosts. If you want the full information for the duplicated routes, try this one:
openshift_route_info * on (host) group_left(host_name) label_replace((sum by (host) (openshift_route_info) > 1), "host_name", "$0", "host", ".+")
Why the label_replace? because to get the full info, joining the openshift_route_info metric with itself was necessary, but, as both sides of the join have the same labels, there wasn’t any extra label to join by.
What you can do is to perform a label_replace to create a new label host_name with the content of the host label and the join will work.
Routes with Issues
Let’s get what are the routes with issues (a.k.a. routes with a False status)
openshift_route_status{status == 'False'} > 0
Builds
New Builds, by Processing Time
Let’s list the new builds, by how many time they have been processing. This query can be useful to detect slow processes.
time() - (openshift_build_created_timestamp_seconds) * on (build) group_left(build_phase) (openshift_build_status_phase_total{build_phase="new"} == 1)
Builds with Errors
Use this query to get builds that are in failed or error state.
sum by (build, buildconfig, kube_namespace_name, kube_cluster_name) (openshift_build_status_phase_total{build_phase=~"failed|error"}) > 0
Agent Configuration
The default agent job for this integration is as follows:
- job_name: 'openshift-state-metrics'
  tls_config:
    insecure_skip_verify: true
  bearer_token_file: /var/run/secrets/kubernetes.io/serviceaccount/token
  scheme: https
  kubernetes_sd_configs:
  - role: pod
  relabel_configs:
  - action: keep
    source_labels: [__meta_kubernetes_pod_host_ip]
    regex: __HOSTIPS__
  - action: drop
    source_labels: [__meta_kubernetes_pod_annotation_promcat_sysdig_com_omit]
    regex: true
  - source_labels: [__meta_kubernetes_pod_phase]
    action: keep
    regex: Running
  - action: replace
    source_labels:
    - __meta_kubernetes_pod_container_name
    regex: (openshift-state-metrics)
    replacement: openshift-state-metrics
    target_label: __meta_kubernetes_pod_annotation_promcat_sysdig_com_integration_type
  - action: keep
    source_labels:
    - __meta_kubernetes_pod_annotation_promcat_sysdig_com_integration_type
    regex: "openshift-state-metrics"
  - action: replace
    source_labels: [__address__]
    regex: ([^:]+)(?::\d+)?
    replacement: $1:8443
    target_label: __address__
  - action: replace
    source_labels: [__meta_kubernetes_pod_uid]
    target_label: sysdig_k8s_pod_uid
  - action: replace
    source_labels: [__meta_kubernetes_pod_container_name]
    target_label: sysdig_k8s_pod_container_name
  - action: replace
    source_labels: [ __address__ ]
    target_label: _sysdig_integration_openshift_state_metrics
    replacement: true
  metric_relabel_configs:
  - source_labels: [__name__]
    regex: (openshift_build_created_timestamp_seconds|openshift_build_status_phase_total|openshift_clusterresourcequota_usage|openshift_route_status)
    action: keep
Feedback
Was this page helpful?
Glad to hear it! Please tell us how we can improve.
Sorry to hear that. Please tell us how we can improve.