AWS MetricsStream Fargate
Metrics, Dashboards, Alerts and more for AWS MetricsStream Fargate Integration in Sysdig Monitor.
This integration can be enabled via the Connect an AWS Account page.
This integration has 9 metrics.
This integration requires ‘CloudWatch Container Insights’ to be enabled in the AWS ECS account settings.
List of Alerts
| Alert | Description | Format |
|---|---|---|
| [AWS Fargate] High Cpu Utilization Rate | High Cpu Utilization Rate. | Prometheus |
| [AWS Fargate] High Memory Utilization Rate | High Memory Utilization Rate. | Prometheus |
| [AWS Fargate] Recurring Pending Tasks | Recurring Pending Tasks. | Prometheus |
List of Dashboards
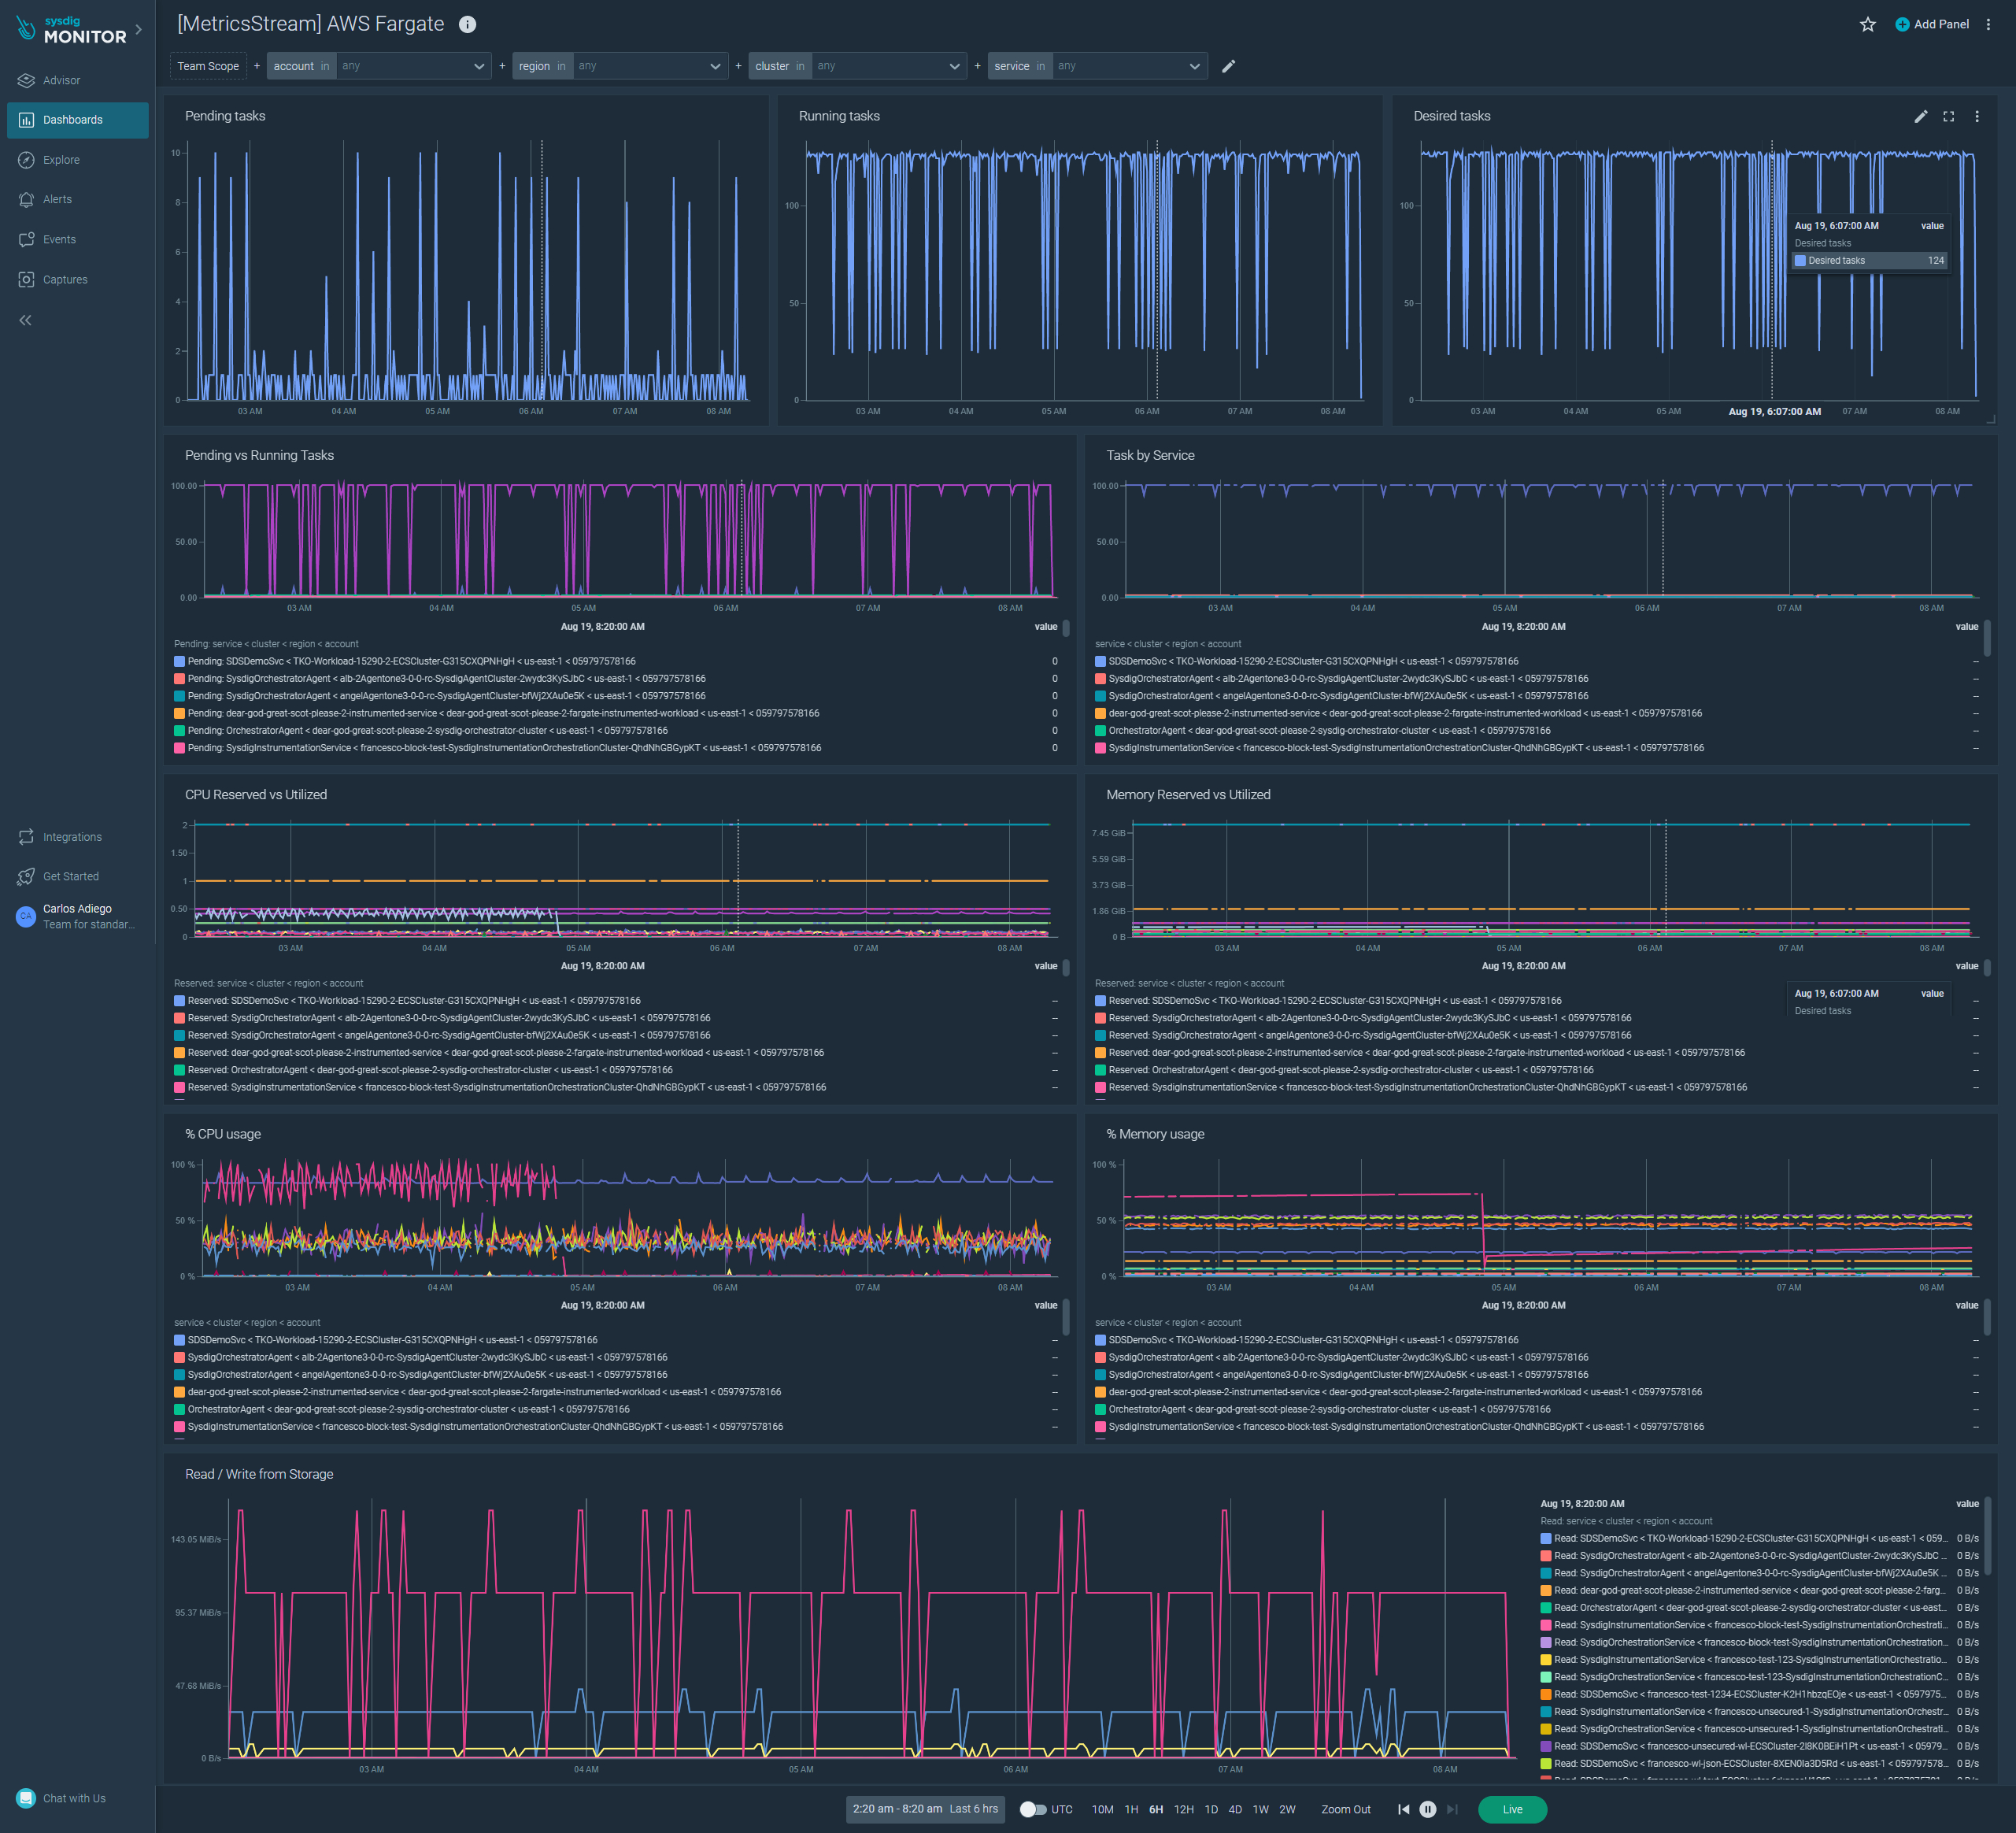
AWS ECS/Fargate
The dashboard provides information on the AWS ECS/Fargate integration.

List of Metrics
| Metric name |
|---|
| aws_ecs_container_insights_cpu_reserved |
| aws_ecs_container_insights_cpu_utilized |
| aws_ecs_container_insights_desired_task_count |
| aws_ecs_container_insights_memory_reserved |
| aws_ecs_container_insights_memory_utilized |
| aws_ecs_container_insights_pending_task_count |
| aws_ecs_container_insights_running_task_count |
| aws_ecs_container_insights_storage_read_bytes |
| aws_ecs_container_insights_storage_write_bytes |
Feedback
Was this page helpful?
Glad to hear it! Please tell us how we can improve.
Sorry to hear that. Please tell us how we can improve.