Grafana Integration
Prometheus
The Prometheus data source comes with Grafana and is natively compatible with PromQL. Sysdig provides a Prometheus-compatible API to achieve API-only integration with Grafana.
For Grafana versions 6.7.0 or beyond, configure the datasource as given in Using the Prometheus API on Grafana v6.7 and Above.
For Grafana versions below 6.7.0, configure datasource as given in Using the Grafana API on Grafana v6.6 and Below.
Sysdig
The Sysdig data source relies on the Sysdig native API instead of the Prometheus API. It requires additional settings and is generally compatible with the simple “form-based” data configuration. See Sysdig Grafana datasource for more information.
The Sysdig option is only recommended for on-prem enviroments on version 5.x or lower.
Using the Prometheus API on Grafana v6.7 and Above
You use the Sysdig Prometheus API to set up the datasource to use with Grafana. Before Grafana can consume Sysdig metrics, Grafana must authenticate itself to Sysdig. To do so, you must set up an HTTP authentication by using the Sysdig API Token because no UI support is currently available on Grafana.
Assuming that you are not using Grafana, spin up a Grafana container as follows:
$ docker run --rm -p 3000:3000 --name grafana grafana/grafanaLogin to Grafana as administrator and create a new datasource by using the following information:
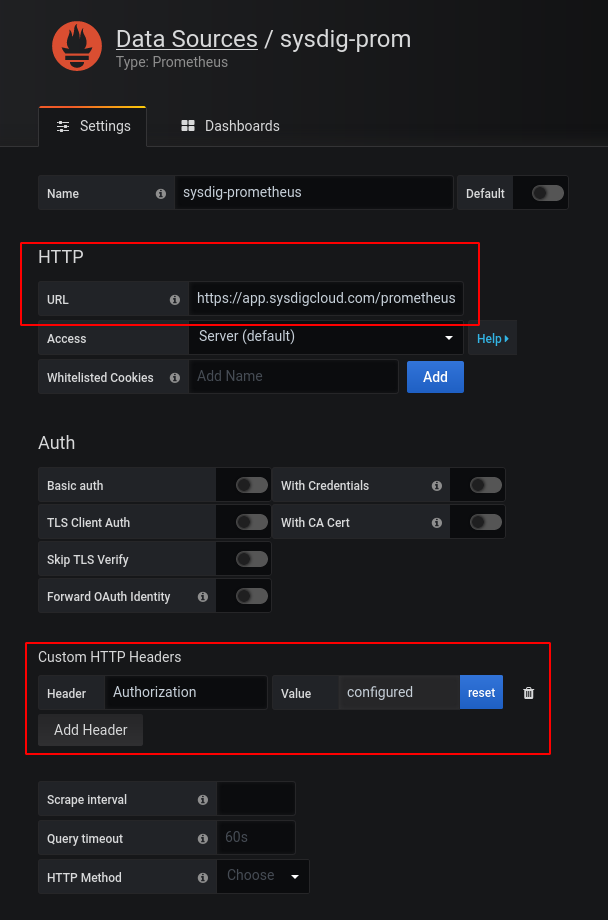
URL:
https://<Monitor URL for Your Region>/prometheusSee SaaS Regions and IP Ranges and identify the correct URLs associated with your Sysdig application and region.
Authentication: Do not select any authentication mechanisms.
Access: Server (default)
Custom HTTP Headers:
Header: Enter the word, Authorization
Value: Enter the word, Bearer , followed by a space and <Your Sysdig API Token>
API Token is available through Settings > User Profile > Sysdig Monitor API.
Using the Grafana API on Grafana v6.6 and Below
The feature requires Grafana v5.3.0 or above.
You use the Grafana API to set up the Sysdig datasource.
Download and run Grafana in a container.
docker run --rm -p 3000:3000 --name grafana grafana/grafanaCreate a JSON file.
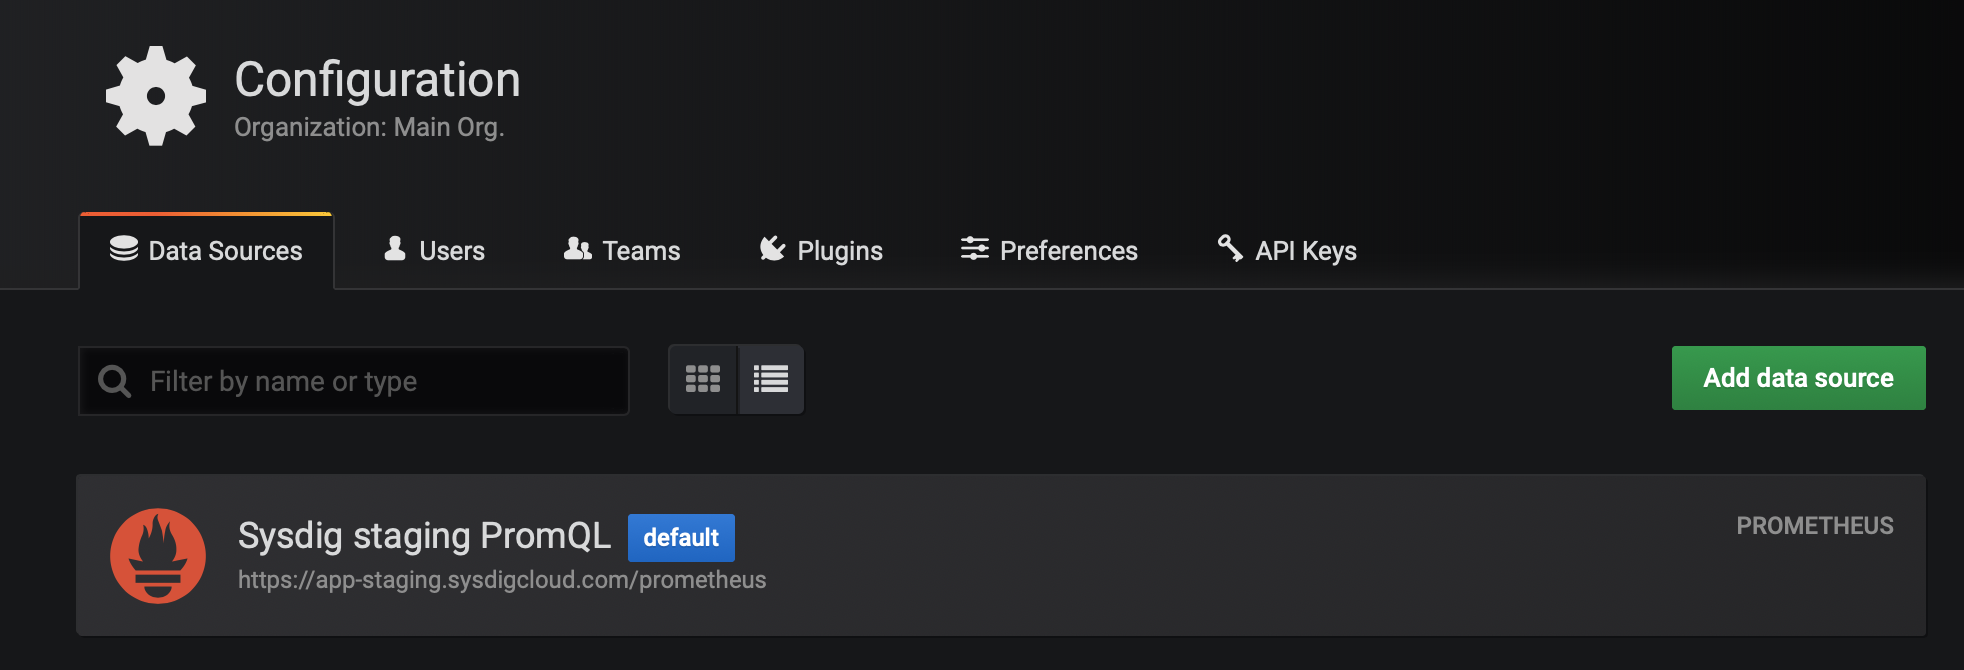
cat grafana-stg-ds.json{ "name": "Sysdig staging PromQL", "orgId": 1, "type": "prometheus", "access": "proxy", "url": "https://app-staging.sysdigcloud.com/prometheus", "basicAuth": false, "withCredentials": false, "isDefault": false, "editable": true, "jsonData": { "httpHeaderName1": "Authorization", "tlsSkipVerify": true }, "secureJsonData": { "httpHeaderValue1": "Bearer your-Sysdig-API-token" } }Get your Sysdig API Token and plug it in the JSON file above.
"httpHeaderValue1": "Bearer your_Sysdig_API_Token"Add the datasource to Grafana.
curl -u admin:admin -H "Content-Type: application/json" http://localhost:3000/api/datasources -XPOST -d @grafana-stg-ds.jsonRun Grafana.
http://localhost:3000Use the default credentials,
admin: admin, to sign in to Grafana.Open the Data Source tab under Configuration on Grafana and confirm that the one you have added is listed on the page.