Integrate Node.js Application Metrics
To monitor node.js applications, link a library to the Node.js code, which then creates a server in the code to export the StatsD metrics.
The example below shows a node.js application that exports metrics using the Prometheus protocol:
{
          "name": "node-example",
          "version": "1.0.0",
          "description": "Node example exporting metrics via Prometheus",
          "main": "index.js",
          "scripts": {
            "test": "echo \"Error: no test specified\" && exit 1"
          },
          "license": "BSD-2-Clause",
          "dependencies": {
            "express": "^4.14.0",
            "gc-stats": "^1.0.0",
            "prom-client": "^6.3.0",
            "prometheus-gc-stats": "^0.3.1"
          }
}
The index.js library function is shown below:
        // Use express as HTTP middleware
        // Feel free to use your own
        var express = require('express')
                var app = express()

        // Initialize Prometheus exporter
                const prom = require('prom-client')
                const prom_gc = require('prometheus-gc-stats')
                prom_gc()

        // Sample HTTP route
                app.get('/', function (req, res) {
                res.send('Hello World!')
                })

        // Export Prometheus metrics from /metrics endpoint
                app.get('/metrics', function(req, res) {
                res.end(prom.register.metrics());
                });

                app.listen(3000, function () {
                console.log('Example app listening on port 3000!')
                })
Integrate a Node.js Application
To integrate a Node.js application:
Add an appcheck in the
dockerfile:FROM node:latest WORKDIR /app ADD package.json ./ RUN npm install ENV SYSDIG_AGENT_CONF 'app_checks: [{name: node, check_module: prometheus, pattern: {comm: node}, conf: { url: "http://localhost:{port}/metrics" }}]' ADD index.js ./ ENTRYPOINT [ "node", "index.js" ]Run the application:
user@host:~$ docker build -t node-example
user@host:~$ docker run -d node-example
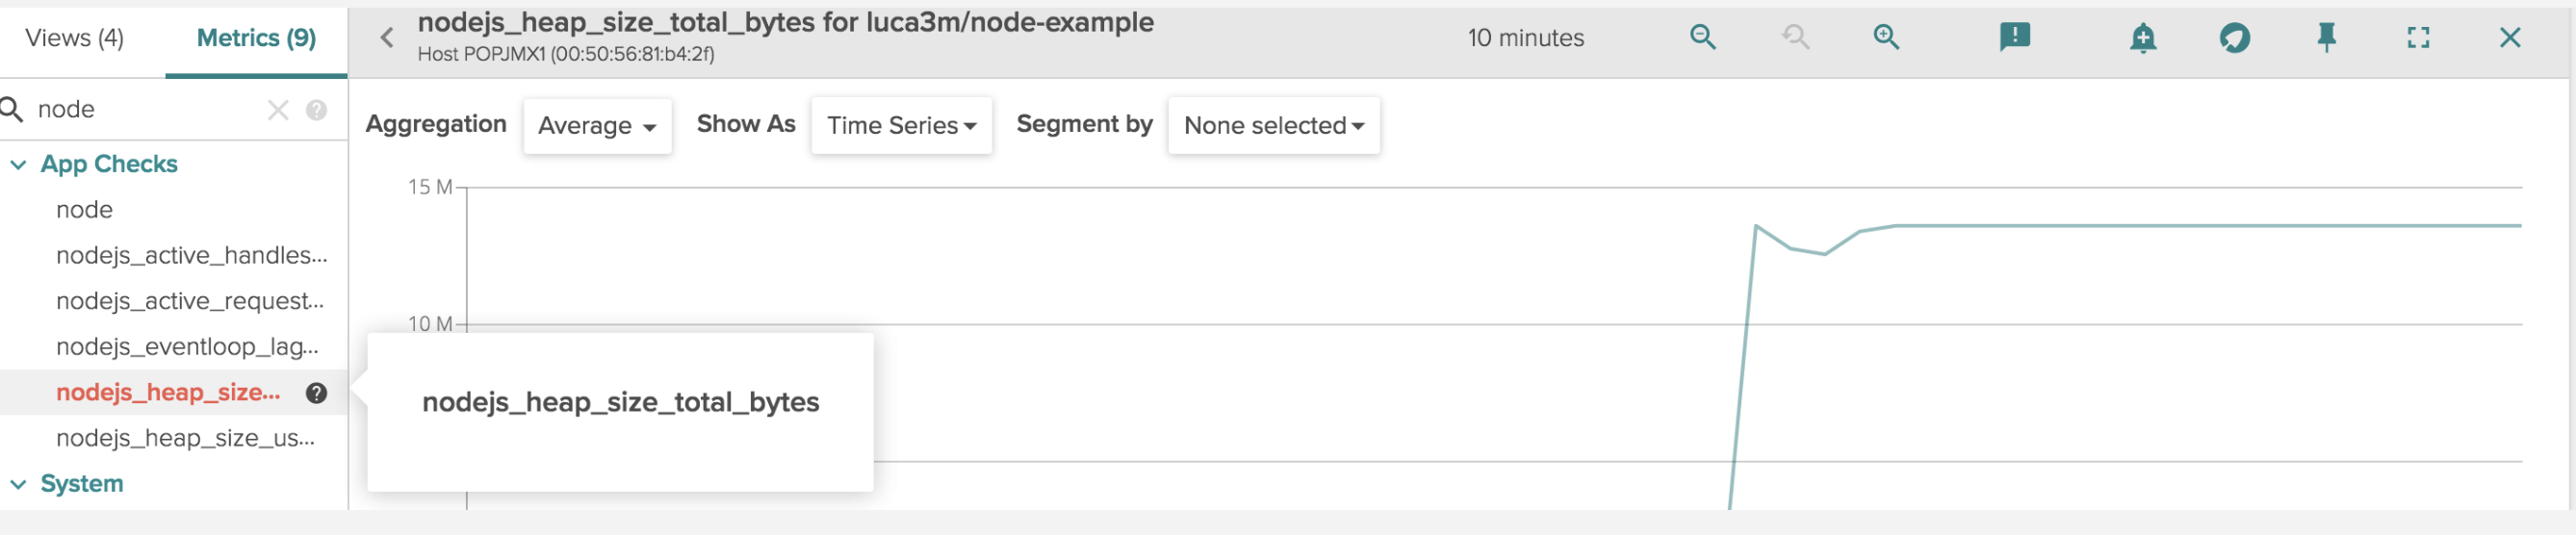
Once the Sysdig agent is deployed, Node.js metrics will be automatically retrieved. The image below shows an example of key Node.js metrics visible on the Sysdig Monitor UI:
For code and configuration examples, refer to the GitHub repository.