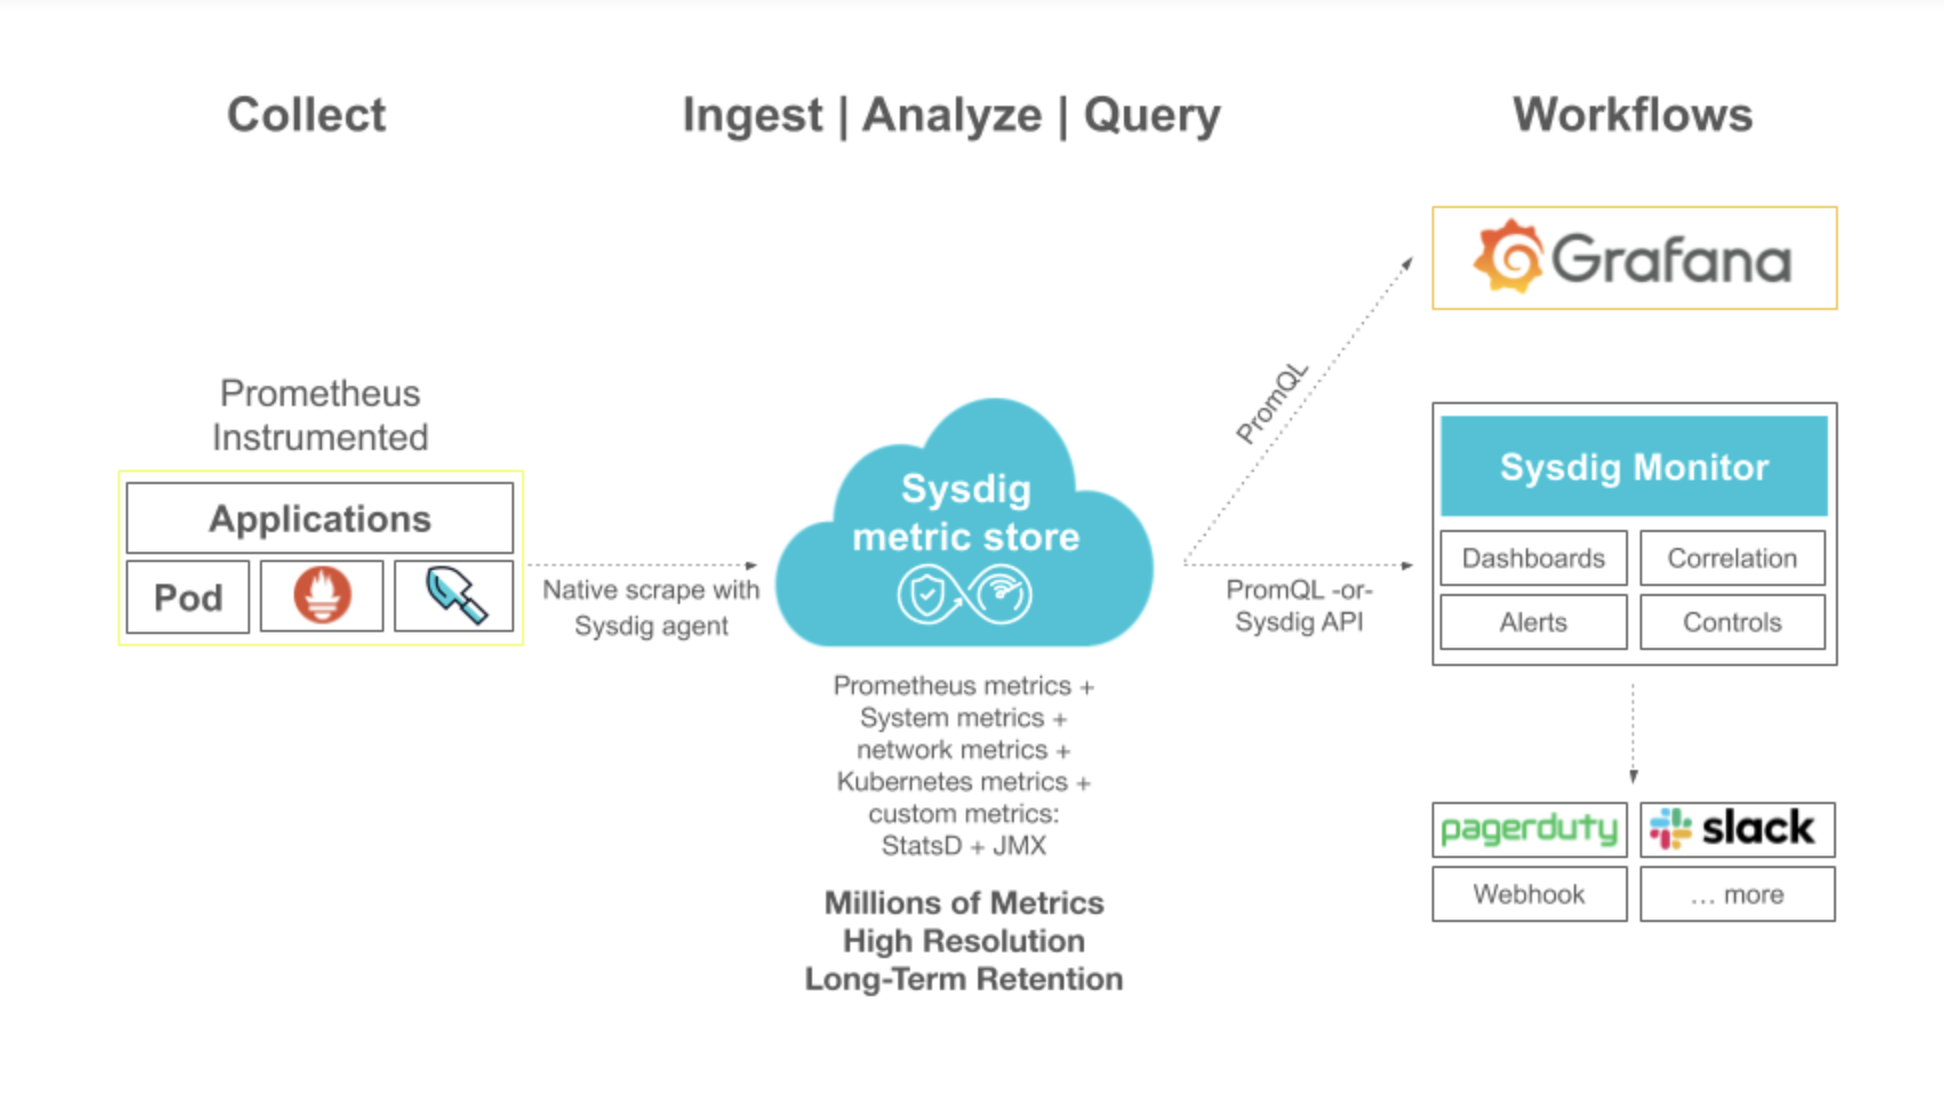
Collect Prometheus Metrics
Sysdig is compatible with Prometheus HTTP API, allowing you to query your monitoring data programmatically using PromQL, and extend Sysdig’s functionality to other platforms, such as Grafana.
A lightweight Prometheus server is directly embedded into the Sysdig agent to facilitate metric collection. Use Prometheus syntax to filter and label targets, instances and jobs, and configure the agent to identify processes that expose Prometheus metric endpoints on its own host and send findings to the Sysdig collector for storing and further processing.
Prerequisites
You do not need to install Prometheus to collect Prometheus metrics.
Agent Compatibility
See the Sysdig agent versions and compatibility with Prometheus features:
Sysdig Agent v12.2.0 and Above
The following features are enabled by default:
- Scrape any Kubernetes pods with the following annotation set:
prometheus.io/scrape=true - Scrape applications supported by Default Integrations.
For more information, see Set up the Environment.
Sysdig Agent Prior to v12.0.0
Manually enable Prometheus in dragent.yaml file:
  prometheus:
       enabled: true
For more information, see Enable Promscrape V2 on Older Versions of Sysdig Agent .
Set Up the Environment
Prometheus metrics are collected with annotations. This page describes how to set up your environment to collect Prometheus metrics if you are not using Kubernetes Service Discovery.
If you are already leveraging Kubernetes Service Discovery, specifically the approach given in prometheus-kubernetes.yml, you might already have annotations attached to the pods that mark them as eligible for scraping. Such environments can quickly begin scraping the same metrics by using the Sysdig agent in a single step.
If you are not using Kubernetes Service Discovery, follow the instructions given below:
Add Annotations
Ensure that the Kubernetes pods that contain your Prometheus exporters have been deployed with the following annotations to enable scraping, substituting the listening exporter-TCP-port:
spec:
  template:
    metadata:
      annotations:
        prometheus.io/scrape: "true"
        prometheus.io/port: "exporter-TCP-port"
The configuration above assumes your exporters use the typical endpoint called /metrics. If your exporter is using a different
endpoint, specify by adding the following additional annotation, substituting the exporter-endpoint-name:
prometheus.io/path: "/exporter-endpoint-name"
Test the Environment
Use this Sample Exporter to test your environment:
Expand
apiVersion: apps/v1
kind: Deployment
metadata:
  name: prometheus-java-app
spec:
  replicas: 1
  selector:
    matchLabels:
      app: prometheus-java-app
  template:
    metadata:
      labels:
        app: prometheus-java-app
      annotations:
        prometheus.io/scrape: "true"
        prometheus.io/path: "/prometheus"
        prometheus.io/port: "8080"
    spec:
      containers:
        - name: prometheus-java-app
          image: luca3m/prometheus-java-app
          imagePullPolicy: Always
You will see auto-discovered Prometheus metrics being displayed on Sysdig Monitor. You can use this working example as a basis to similarly annotate your own exporters.
Dynamic Sampling
Dynamic sampling supports scraping a rotating set of Prometheus endpoints based on the total amount of time series scraped from each endpoint. Once enabled, it ensures consistent and up-to-date data from every Prometheus endpoints on a given node at dynamic intervals, while maintaining the data collection frequency and fidelity of Prometheus metrics via the Sysdig agent."
Sysdig’s ability to collect and process the volumes of data scraped from different Prometheus endpoints depends on the number of time series scraped from each endpoint, the total Prometheus time series collected by the agent in each time window, and the frequency at which Sysdig agent collects and sends the data to the backend.
When nodes have multiple Prometheus endpoints sending high volumes of time series, the Sysdig agent may skip some endpoints depending on the overall volume and scrape frequency.
Dynamic sampling addresses this by cycling through individual Prometheus endpoints and scraping the latest time series from each endpoint on a rotational basis, ensuring all time series from all Prometheus endpoints are processed at dynamic intervals. This results in more time series being scraped and processed overall at a lower frequency. For example, instead of receiving 50,000 time series every 10 seconds, you might receive 100,000 time series every 20 seconds.
Dynamic Sampling Considerations
Any alerts that depend on dynamically-sampled metrics will have the same interval as the metric. Using the example here, the alerts related to either endpoint will be raised, at most, every 20 seconds.
The time series from all the endpoints are sent to the backend in order to prevent data integrity issues. Therefore, if total number of time series from a particular endpoint is greater than the maximum allowed limit by any agent, the time series from that endpoint will be dropped irrespective of whether dynamic sampling is turned on or not.
Sysdig agent always maximizes the allowed limit for every interval as long as all the time series of an endpoint fits in the allowed limit.
Enable Dynamic Sampling
To configure dynamic sampling:
Open the
dragent.yamlfile.Add the following line:
promscrape_emit_all: trueRestart the agent.
