Sysdig Monitor
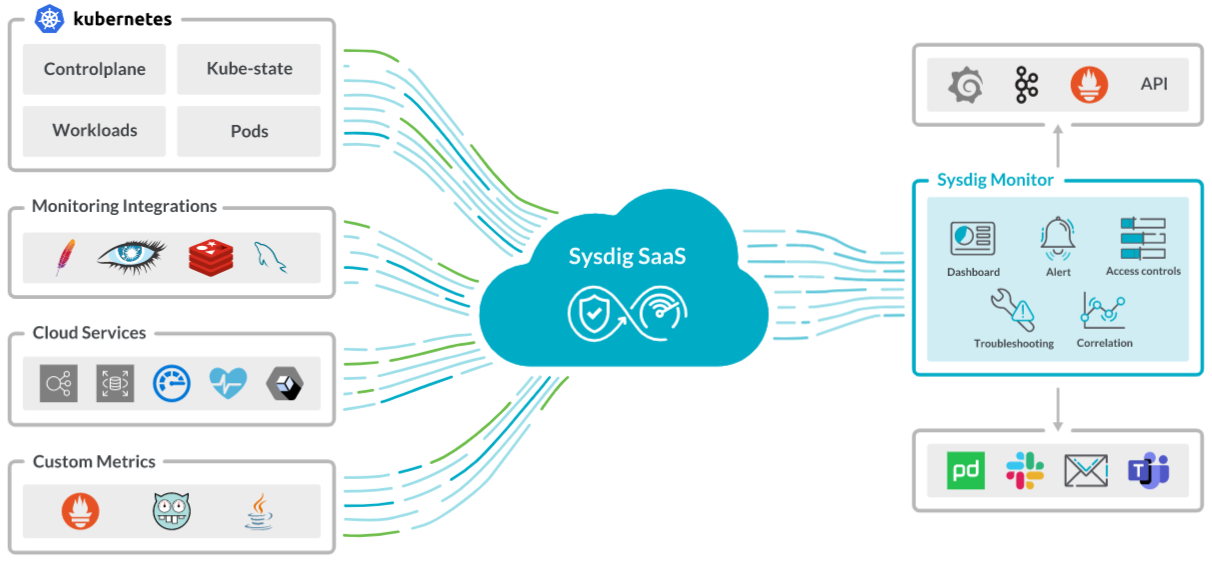
In the background, the Sysdig agent collects appropriate metrics and events from the hosts that are monitored. By default, it reports a comprehensive set of predefined metrics. You can extend its capabilities through agent configuration files and Monitoring and Cloud Integrations to gather additional metrics and custom parameters.
Navigate Time
Sysdig Monitor is designed around time. By default, the UI displays information in Live mode. Sysdig Monitor polls the infrastructure data every 10 seconds for each executed query and refreshes the metrics on the UI. This means that dashboards, Advisor, and the Explore views will be automatically updated with new data as time passes, and will display the most recent data available for the configured time window.
You can select how to view this gathered data by choosing a Preset interval and a time Range.
The time window navigation bar provides you with quick links to common time windows, as well as the ability to configure a custom time period in order to review historical data.

In addition, the navigation bar provides:
Quick links for common time windows
A custom time window configuration option.
A pause/play button to exit Live mode and freeze the data to a time window, and to return to Live mode.
Step back/forward buttons to jump through a time window to review historical data.
Zoom in/out buttons to increase/decrease the time window.
Presets
Presets are a way of visualizing data that Sysdig Monitor gathers every 10 minutes. Select a preset to determine the data sample to be displayed. Overview supports the following presets:
- 5 Minutes
- 1 Hour
- 6 Hour
- 12 Hour
- 1 Day
- 4 Day
- 1 Week
- 2 Weeks
A preset that is 10 minutes or less is refreshed every 30 seconds. A preset that is greater than 10 minutes is refreshed at every 10 second intervals.
Presets work in conjunction with Range selections. Selecting a particular preset interval refreshes Range selection and reloads the data subsequently. For example:
- 10 Minutes: Resets the Range to December 9, 2.20 pm - December 9, 2.30 pm.
- 6 Hour: Resets the Range to December 9, 8.30 am - December 9, 2.30 pm.
- 1 Day: Resets the Range to December 8, 2.30 pm - December 9, 2.30 pm.
Range
Range shows both date and time interval as well as the selected Presets in parenthesis. The Range indicated on the UI is determined by Presets. The time given is the closest time interval and by default, it is the current date and time preset by 1 hour.
Click on the Range tab to open a calendar to select a range.
See Presets to understand how Range works with Presets.
Live
The Live badge shows if the data shown is Live or Paused.
- Live: the data is continuously updated.
- Paused: the data refresh pauses and live updates are stopped.
Time Format
Dashboards support UTC and PDT time formats. Use the toggle button next to Range to change the time format for the slot shown in Range. The default is PDT.
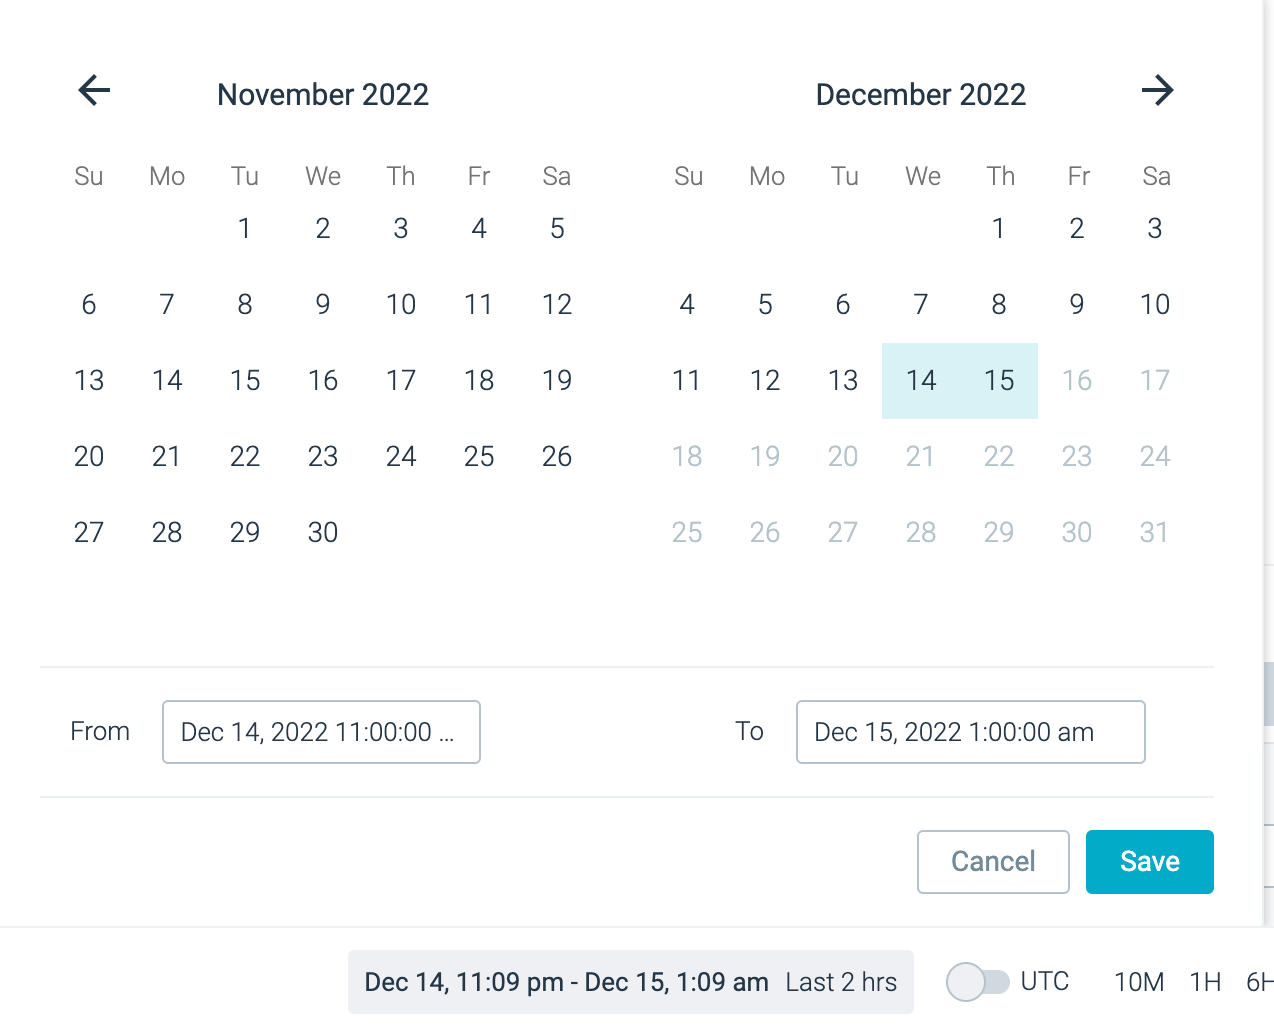
Configure a Custom Time Period
Use the Time Navigation drop-down panel to configure a specific time range.
| Steps | Preview |
|---|---|
| Click the date and time indicator and configure the start and end date and time as desired. Click Save to save the changes. |
|
Use Cases
Kubernetes Monitoring
To get started with Kubernetes monitoring:
- Set up your data sources.
- Start monitoring your Kubernetes infrastructure:
- Use Dashboard Library to view workload and pod status; monitor resource availability in your cluster and workloads; perform cluster capacity planning and pod rightsizing.
- Set up Monitoring Integrations.
- Get started with PromQL.
- Discover issues with Advisor.
- Perform cost optimization using Cost Advisor.
Cost Optimization
Discover where you have wasted resources, how much you are spending on those environments, and the amount of potential savings you could get if you rightsize those environments to a more reasonable level. See Cost Advisor for more information.
Cloud Service Monitoring
Gain deep visibility into your Kubernetes environment regardless of the cloud platform you are running. Collect metrics from cloud providers for their managed services including CloudWatch, Stackdriver, or Azure Metrics, with curated Prometheus exporters and guided integration deployment.
To get started with Cloud Monitoring:
- Set up your data sources.
- Start monitoring the performance of your Cloud environment:
Managed Prometheus
A fully managed Prometheus monitoring service with enterprise features, such as automatic service detection and assisted integration deployment. To get started:
- Set up your Prometheus Remote Write.
- Start monitoring your service:
- Service discovery and assisted integration deployment.
- Set up your environment to collect Prometheus metrics.
- Check how PromQL can be used across Sysdig Monitor.
- Use PromQL Library and build dashboards and alerts.
Application Monitoring
Collect custom Prometheus metrics, StatsD metrics, and JMX metrics to increase visibility into the applications and objects that are unique to your infrastructure and see everything in context.
To get started:
- Set up your data sources.
- Configure custom integrations.
Additional Operations
- Invite your team.
- Create a Notification Channel.
- Turn on Alerts.
Warranty Disclaimer
Customer acknowledges and agrees that it is impossible under any current available technology for any security and/or monitoring software to identify one hundred percent (100%) of cloud threats and risks, vulnerabilities, Errors, malicious software, or an attacker’s behavior (collectively, the “Threats”). Sysdig Secure and Monitor (the “Services”) rely upon threat feeds, behavioral analysis, machine learning, and other techniques that are subject to the limitations set forth in this Documentation. However, these techniques may not be enough to discover all Threats. Further, Customer acknowledges and understands that the Sysdig Services may incorrectly identify Threats, resulting in a false positive. Lastly, Customer acknowledges and understands that by procuring Sysdig’s Services, the Services are just one tool in Customer’s overall cloud strategy and do not represent a shift in responsibility for Customer’s business. Customer remains responsible for ensuring that it has appropriate data security measures in place.