Events Dashboards
The Events Dashboards provide event overviews by data source: Overview (all sources), Kubernetes Clusters, Cloud Accounts, and Hosts and Containers (for environments using containers without Kubernetes orchestration).
The Dashboards are currently in Technical Preview status for Sysdig Secure SaaS.
Prerequisites
Sysdig Secure (SaaS) with data sources connected:
- Kubernetes: Sysdig Agent installed with Kubernetes orchestrator
- Cloud Accounts: Integrated Cloud accounts - AWS, GCP, and/or Azure
- Hosts and Containers: Containers deployed on hosts without Kubernetes orchestration
NOTE:
- If a particular type of data source is not connected , the corresponding overview will show no data.
- Only teams scoped to Entire Infrastructure will see the Dashboards.
Usage
General
Log in to Sysidig Secure (SaaS).
Select Events > Event Dashboards > (choose your data source). One of four panels opens (Overview, Kubernetes, Cloud, or Hosts and Containers).
The events displayed match the permissions of the team under which you logged in.
Select top-level filters to focus on particular subset of event data, as appropriate.
All of the context filters apply to the widget on the page and any drill-down pages.
Common Filters
Severity
Select any or all criticality level: Critical, High, Medium, Info
Date
Each top trend panel reports on the behavior of events over the past 31days.
By default, the trend graphs are set to 1 week. You can use the date selector or double-click on a day to see the Event panel results filtered for just that day. Use the Date bar at the bottom of the page to adjust up to two-weeks-worth of data at a time.
Page-Specific Filters are detailed in the panel descriptions below.
Review the top policies and rules with events and drill down into the Events feed or details to address them.
Review the top activity by location, users, etc. and drill down as needed.
Events Overview
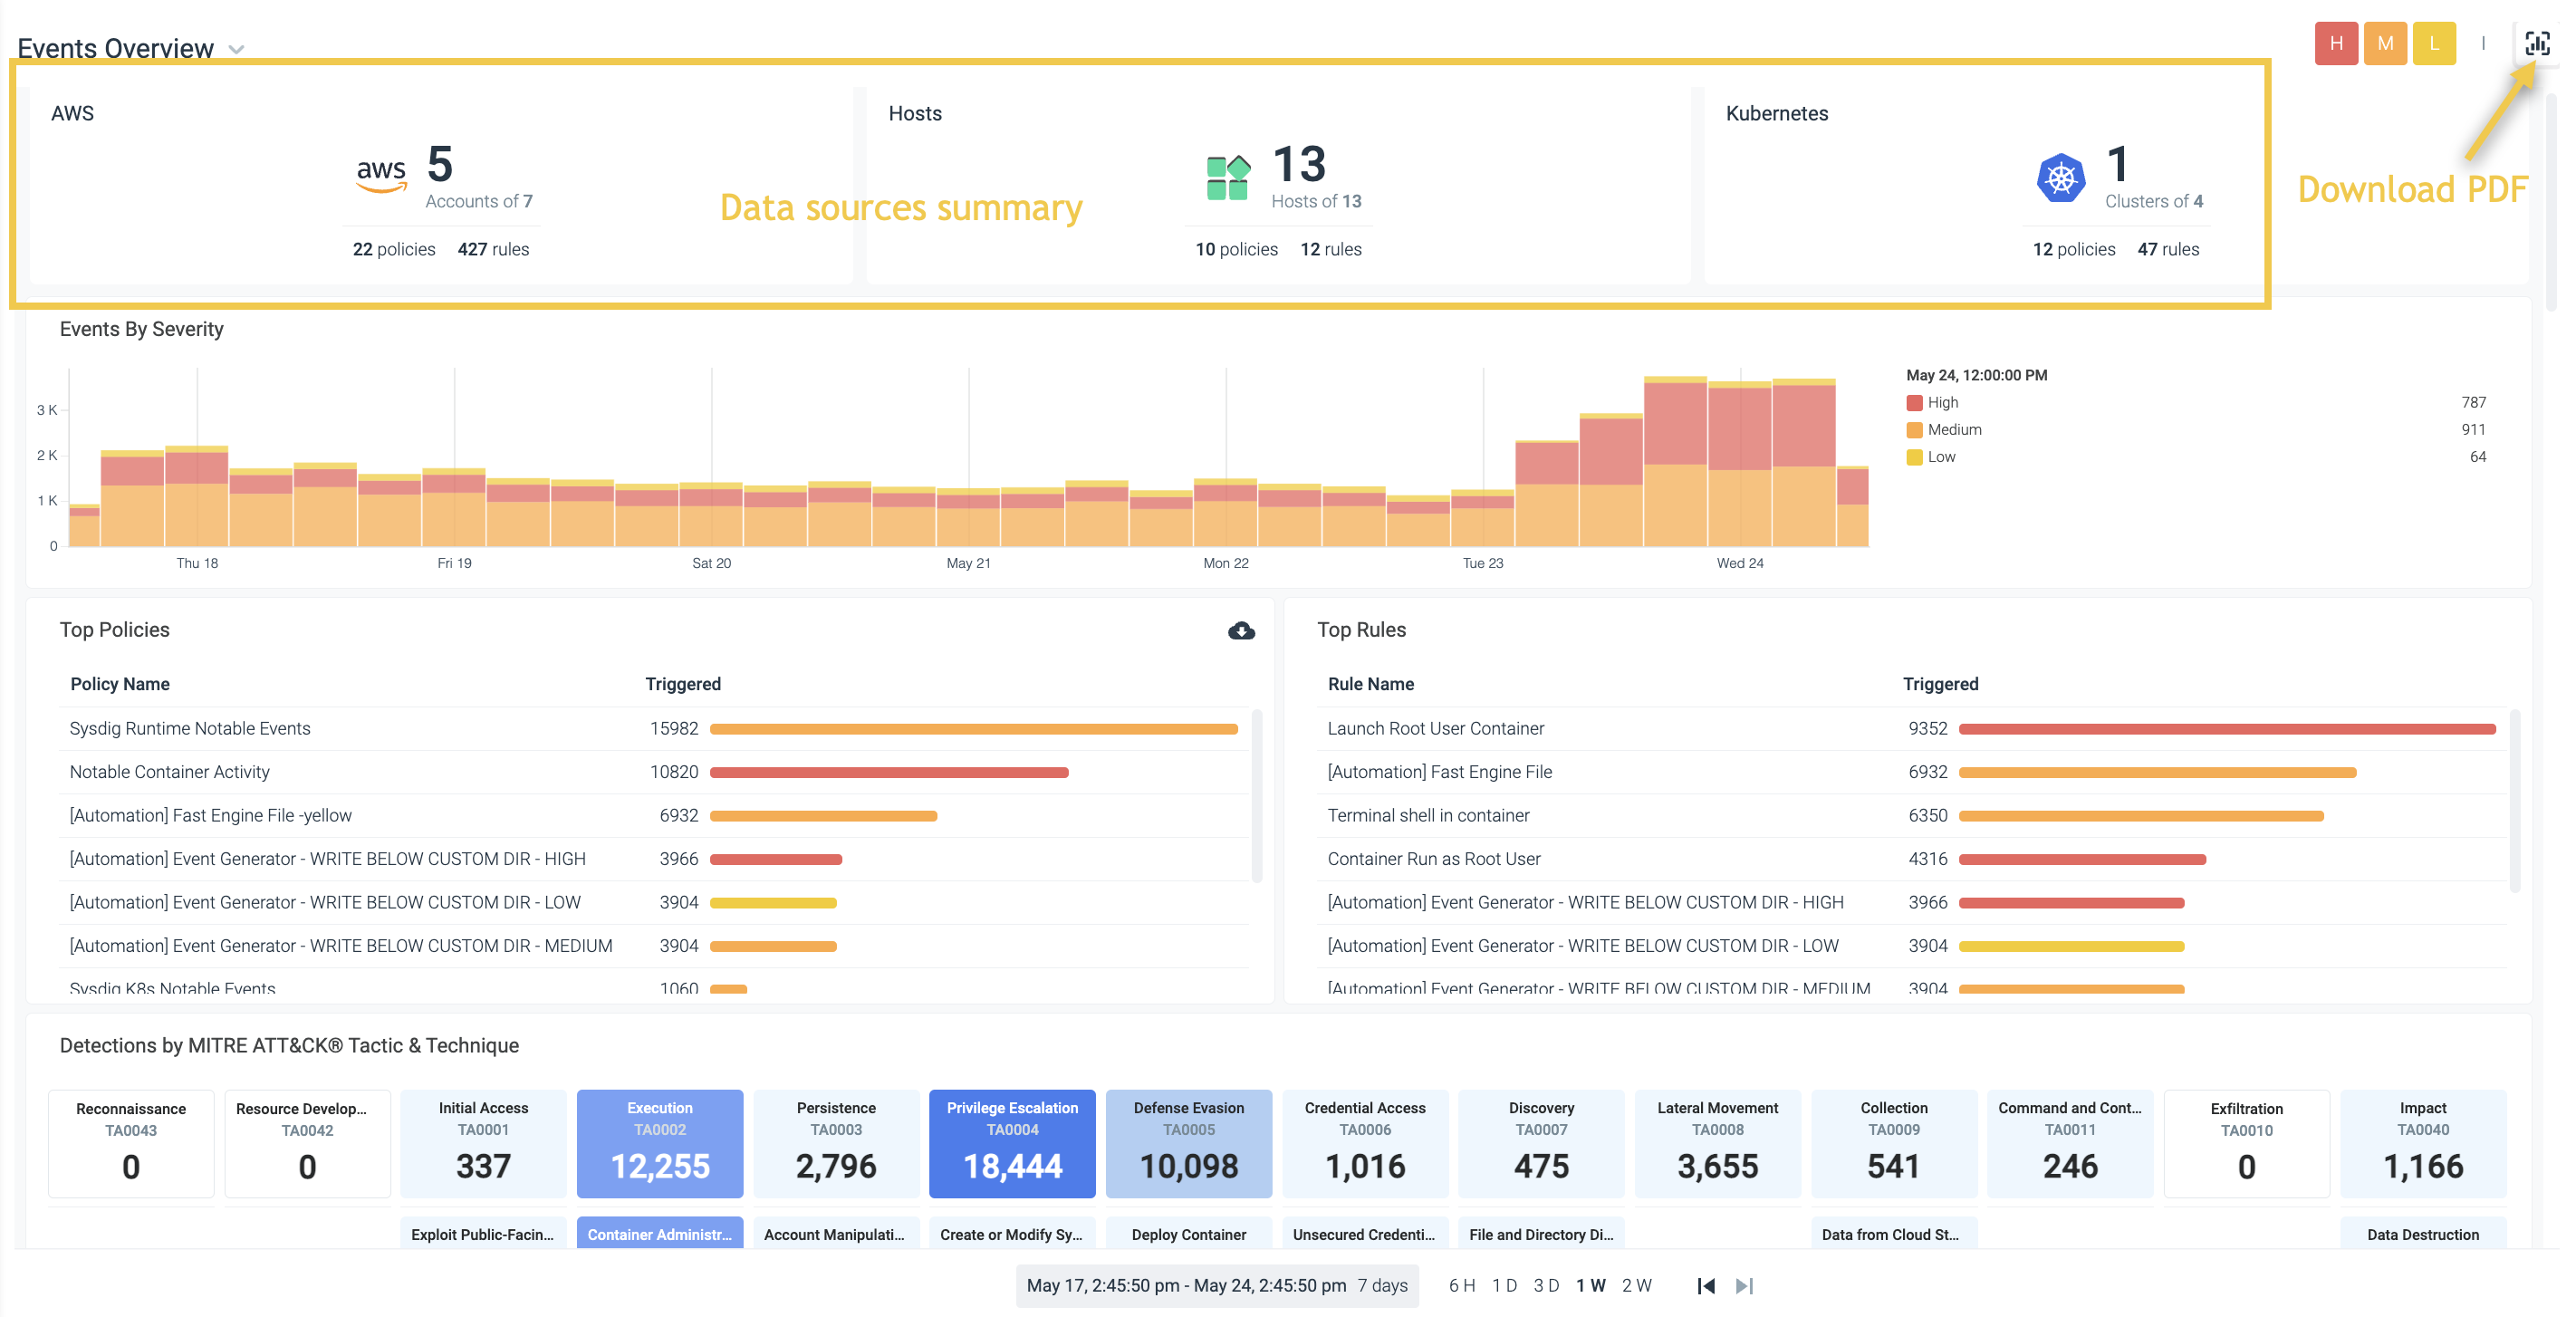
The Overview panel provides:
Top row: the common severity filter and the download button to capture a PDF of the panel display
Top panel: a summary of the data sources and their connected status (5 of 7, for example)
Events by Severity trend graph: Change the date selection at the bottom of the page if desired, or hover over a day to see the event number summarized by severity for that day
Top Policies and Top Rules triggered: click on an entry to drill into the event details
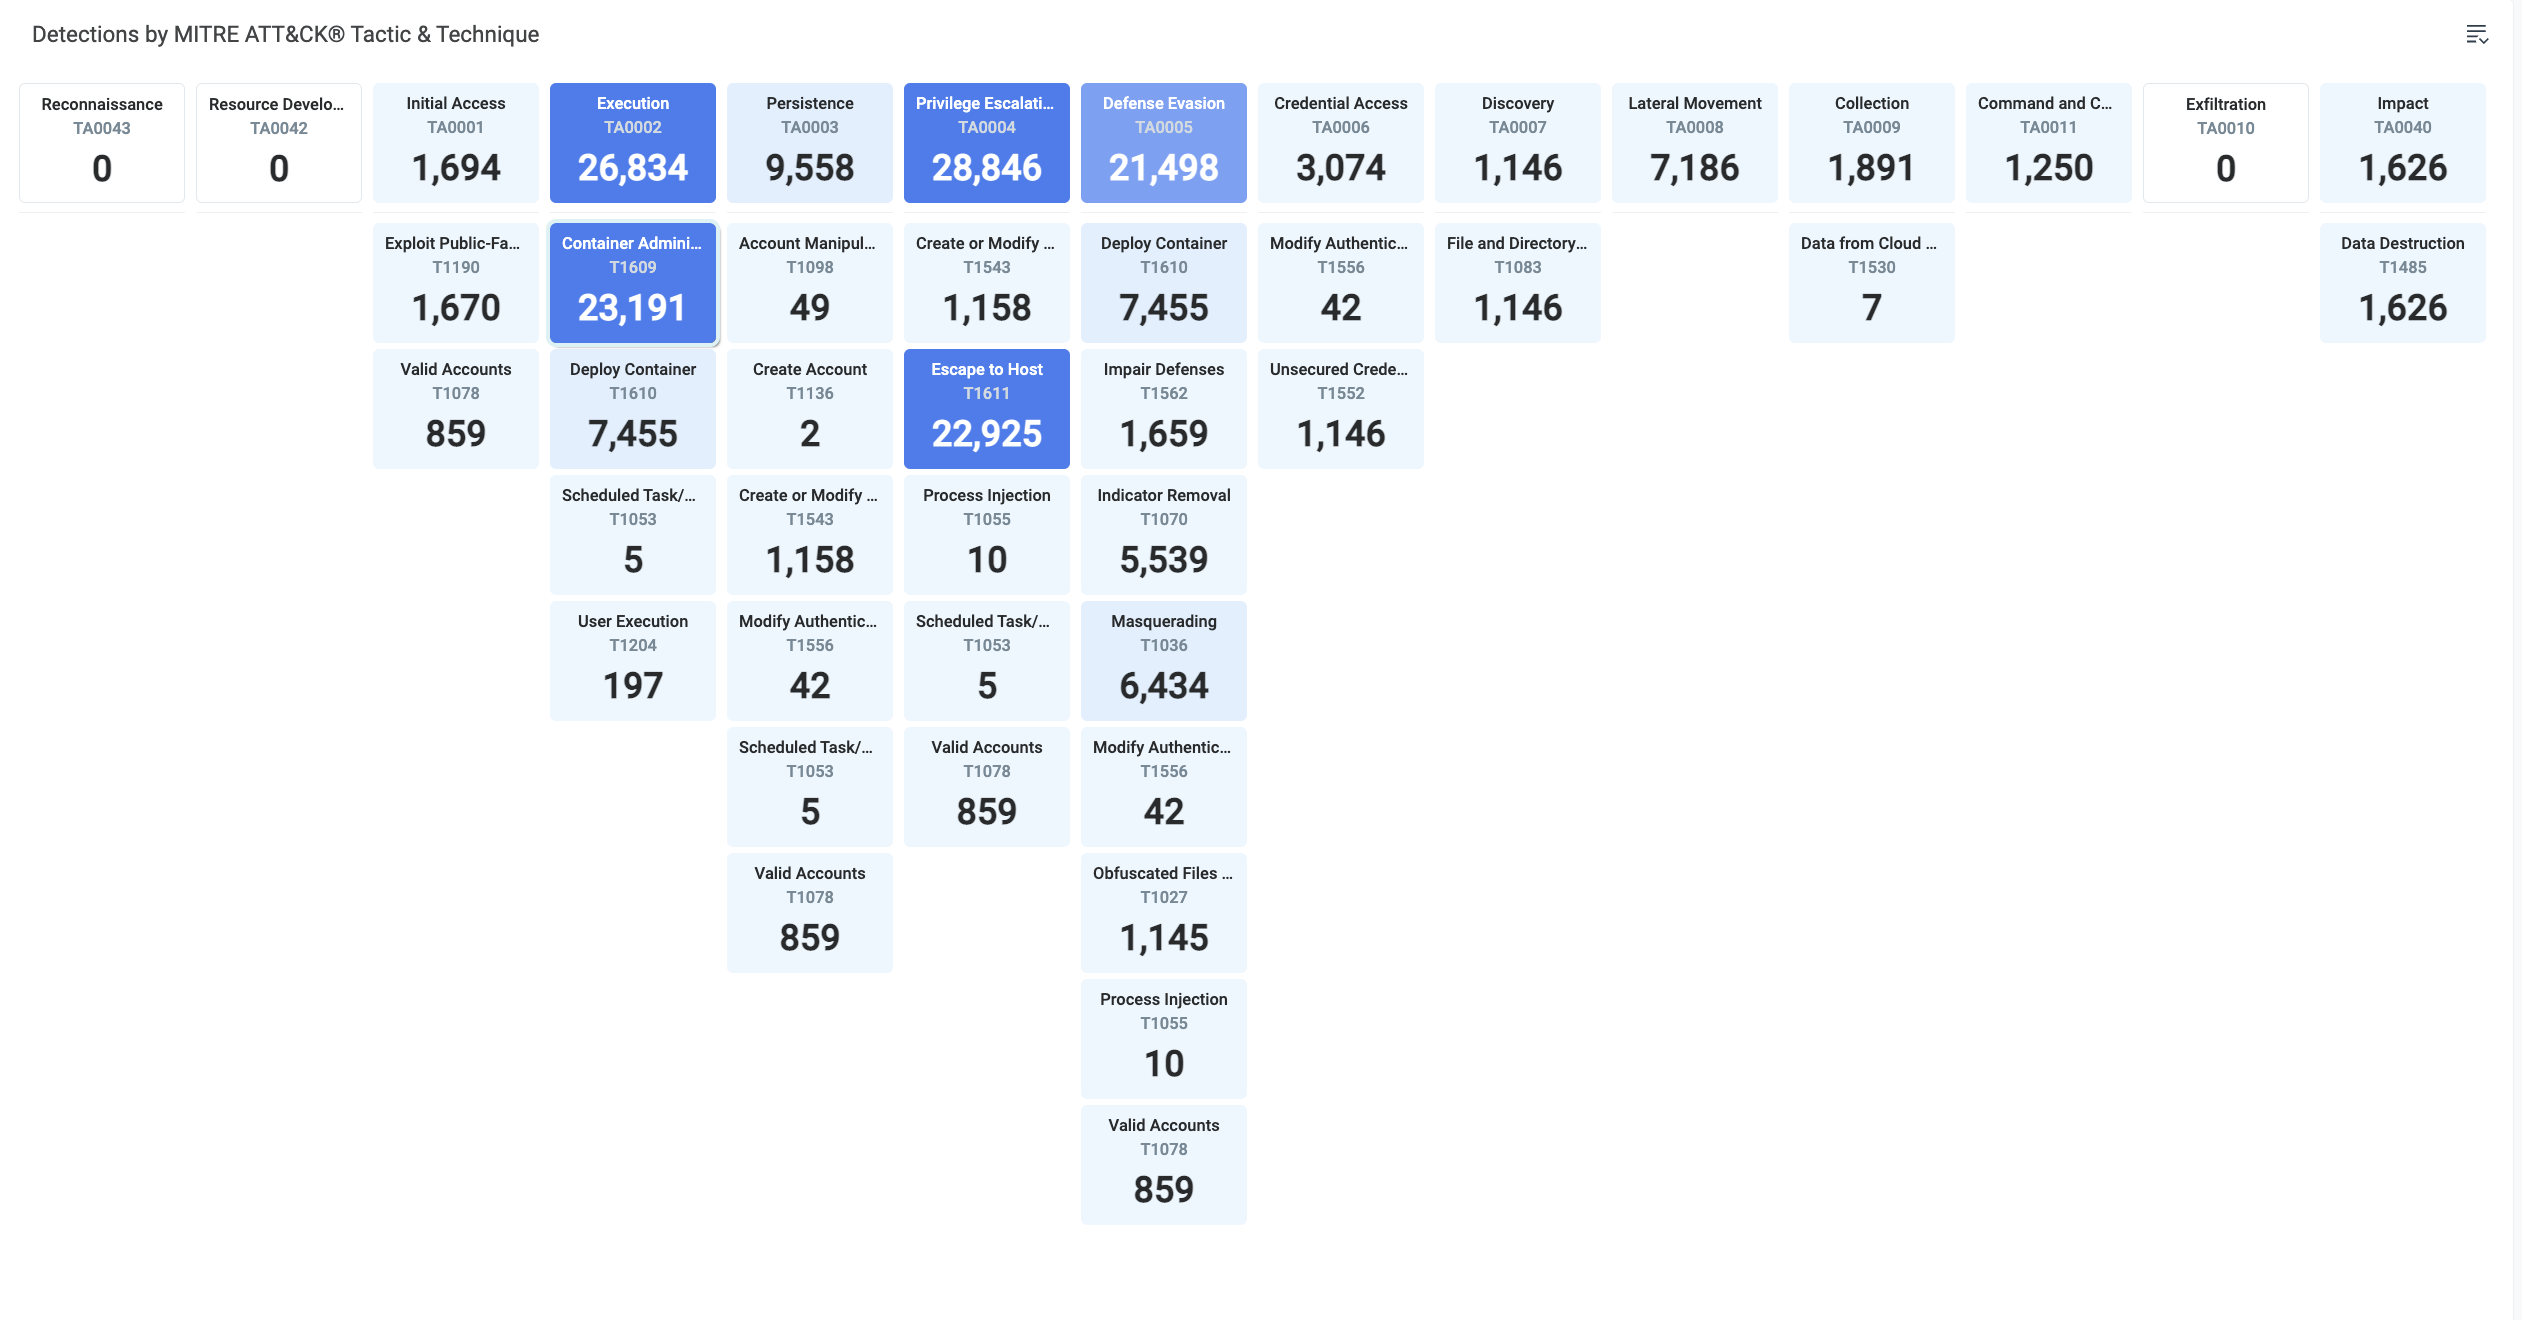
Mitre Attack Report by tactic and technique
Kubernetes Events
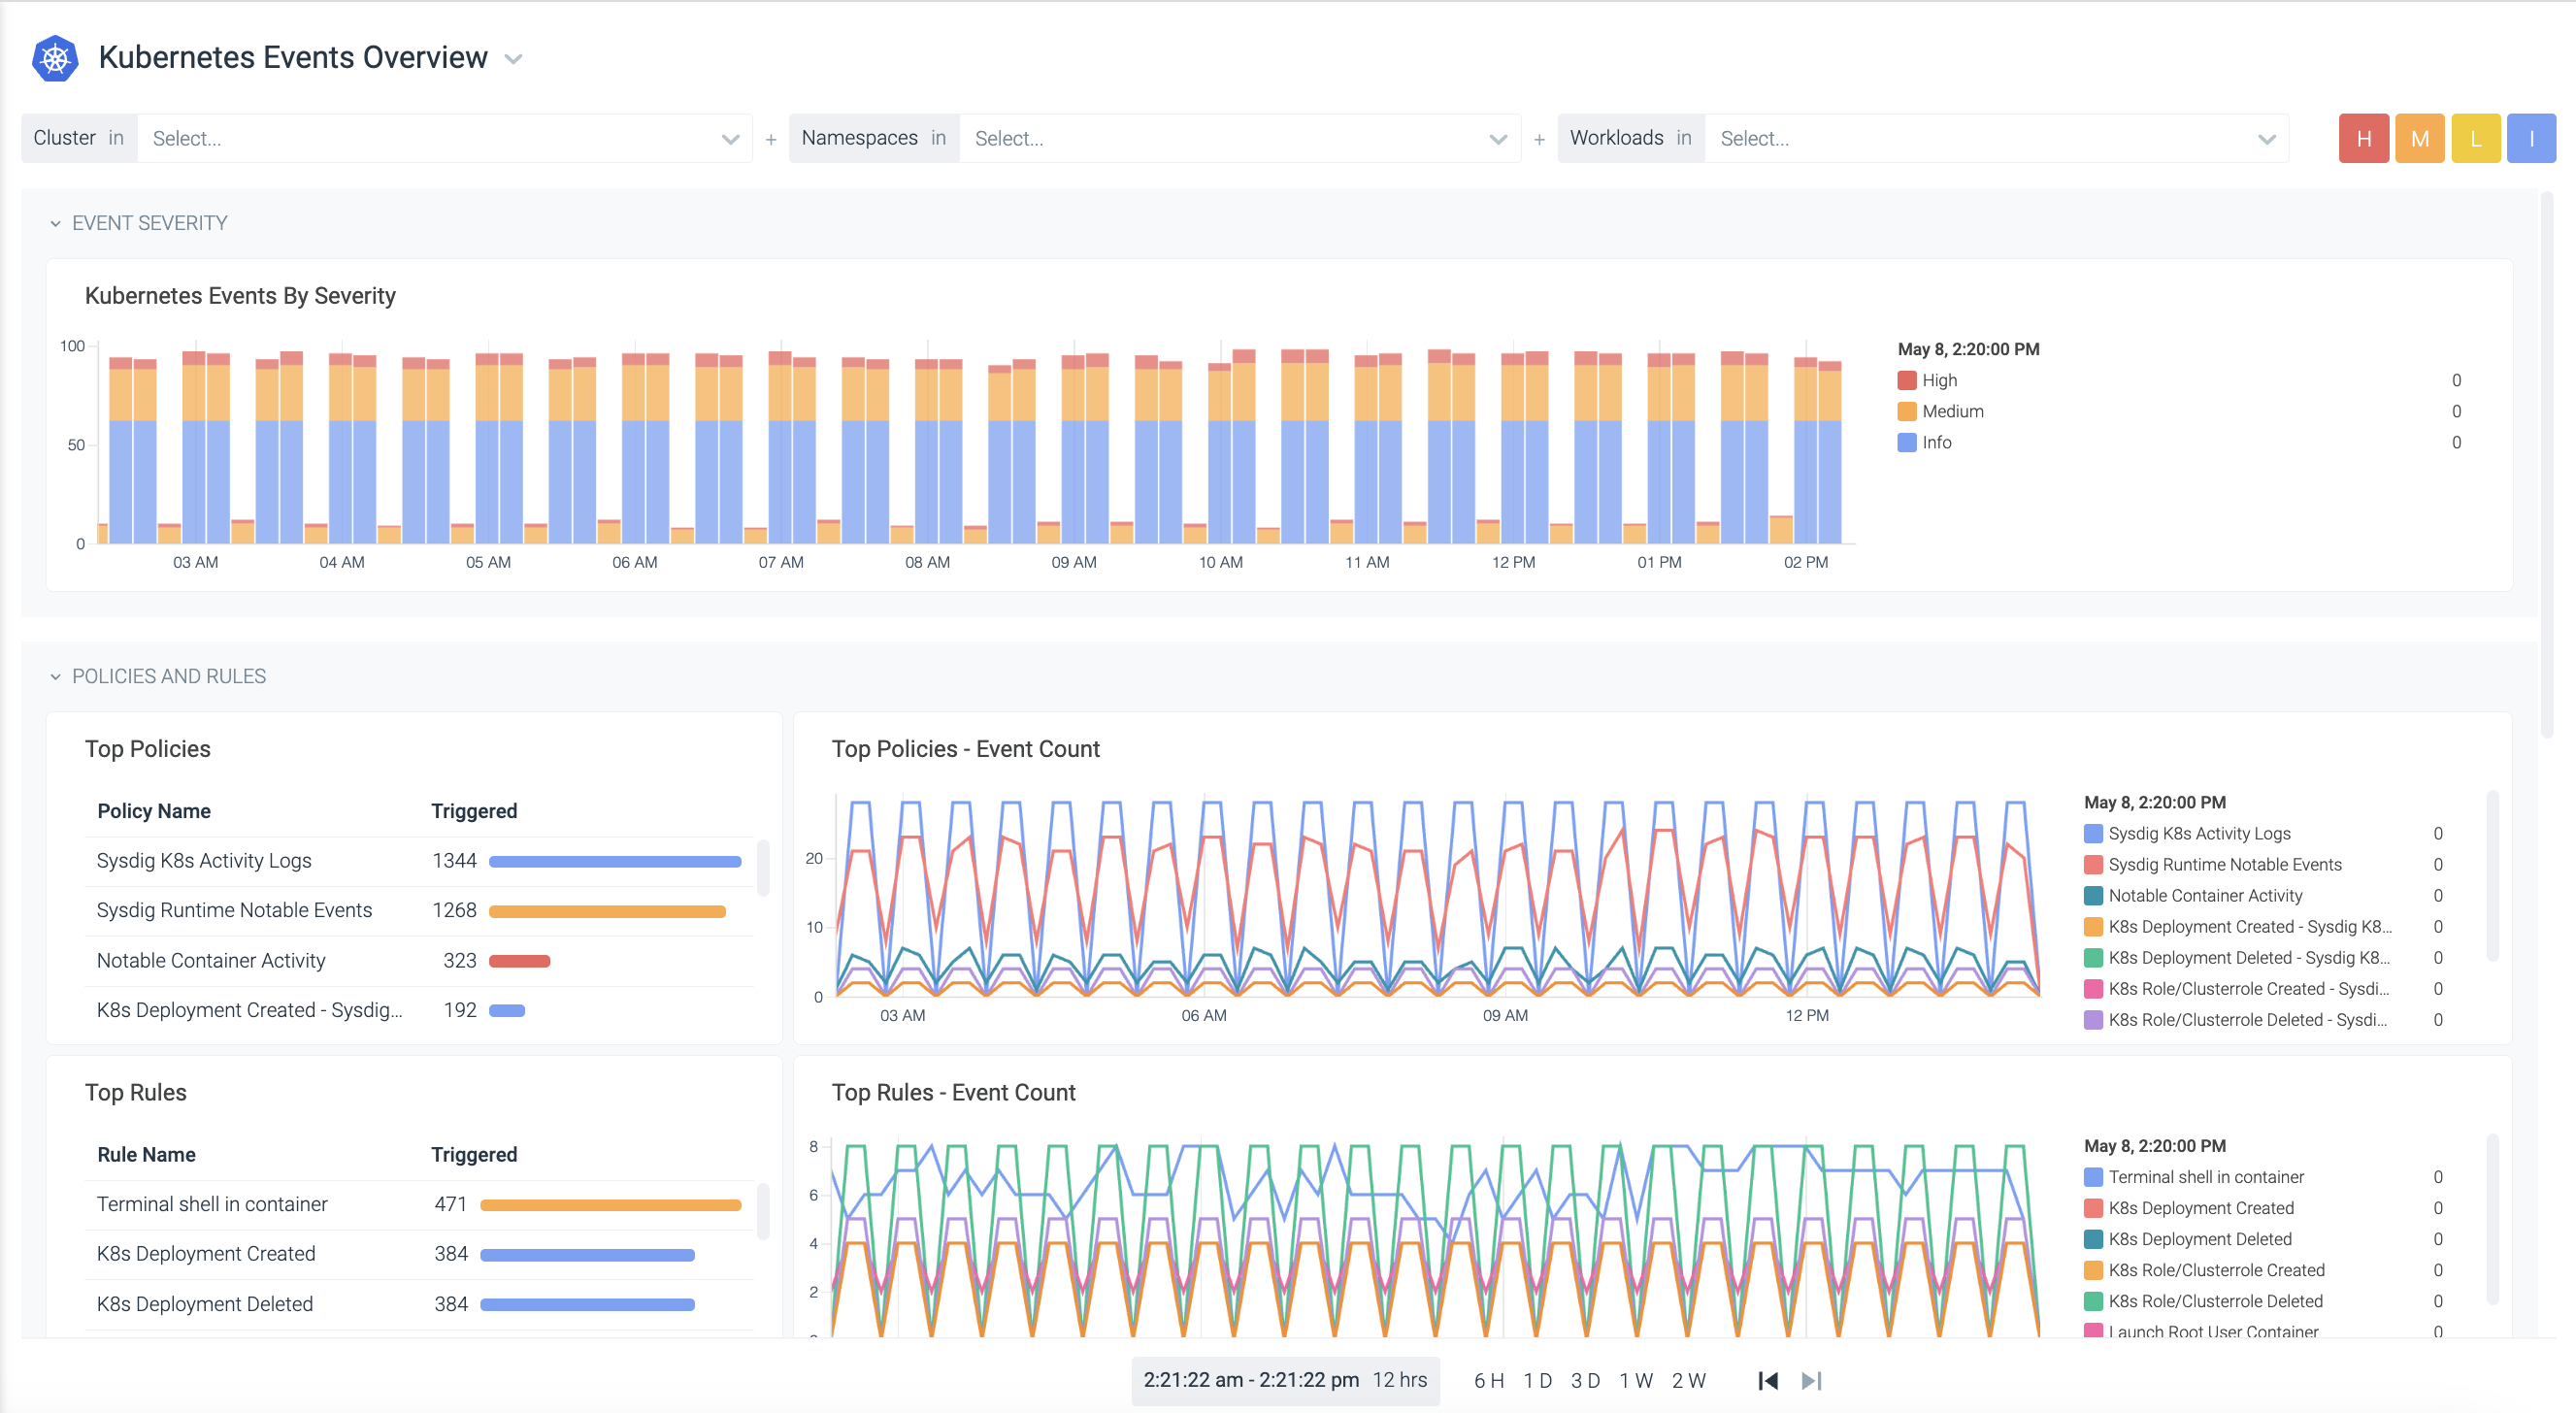
Filters Available
- Cluster
- Namespace
- Workload
Cloud Events
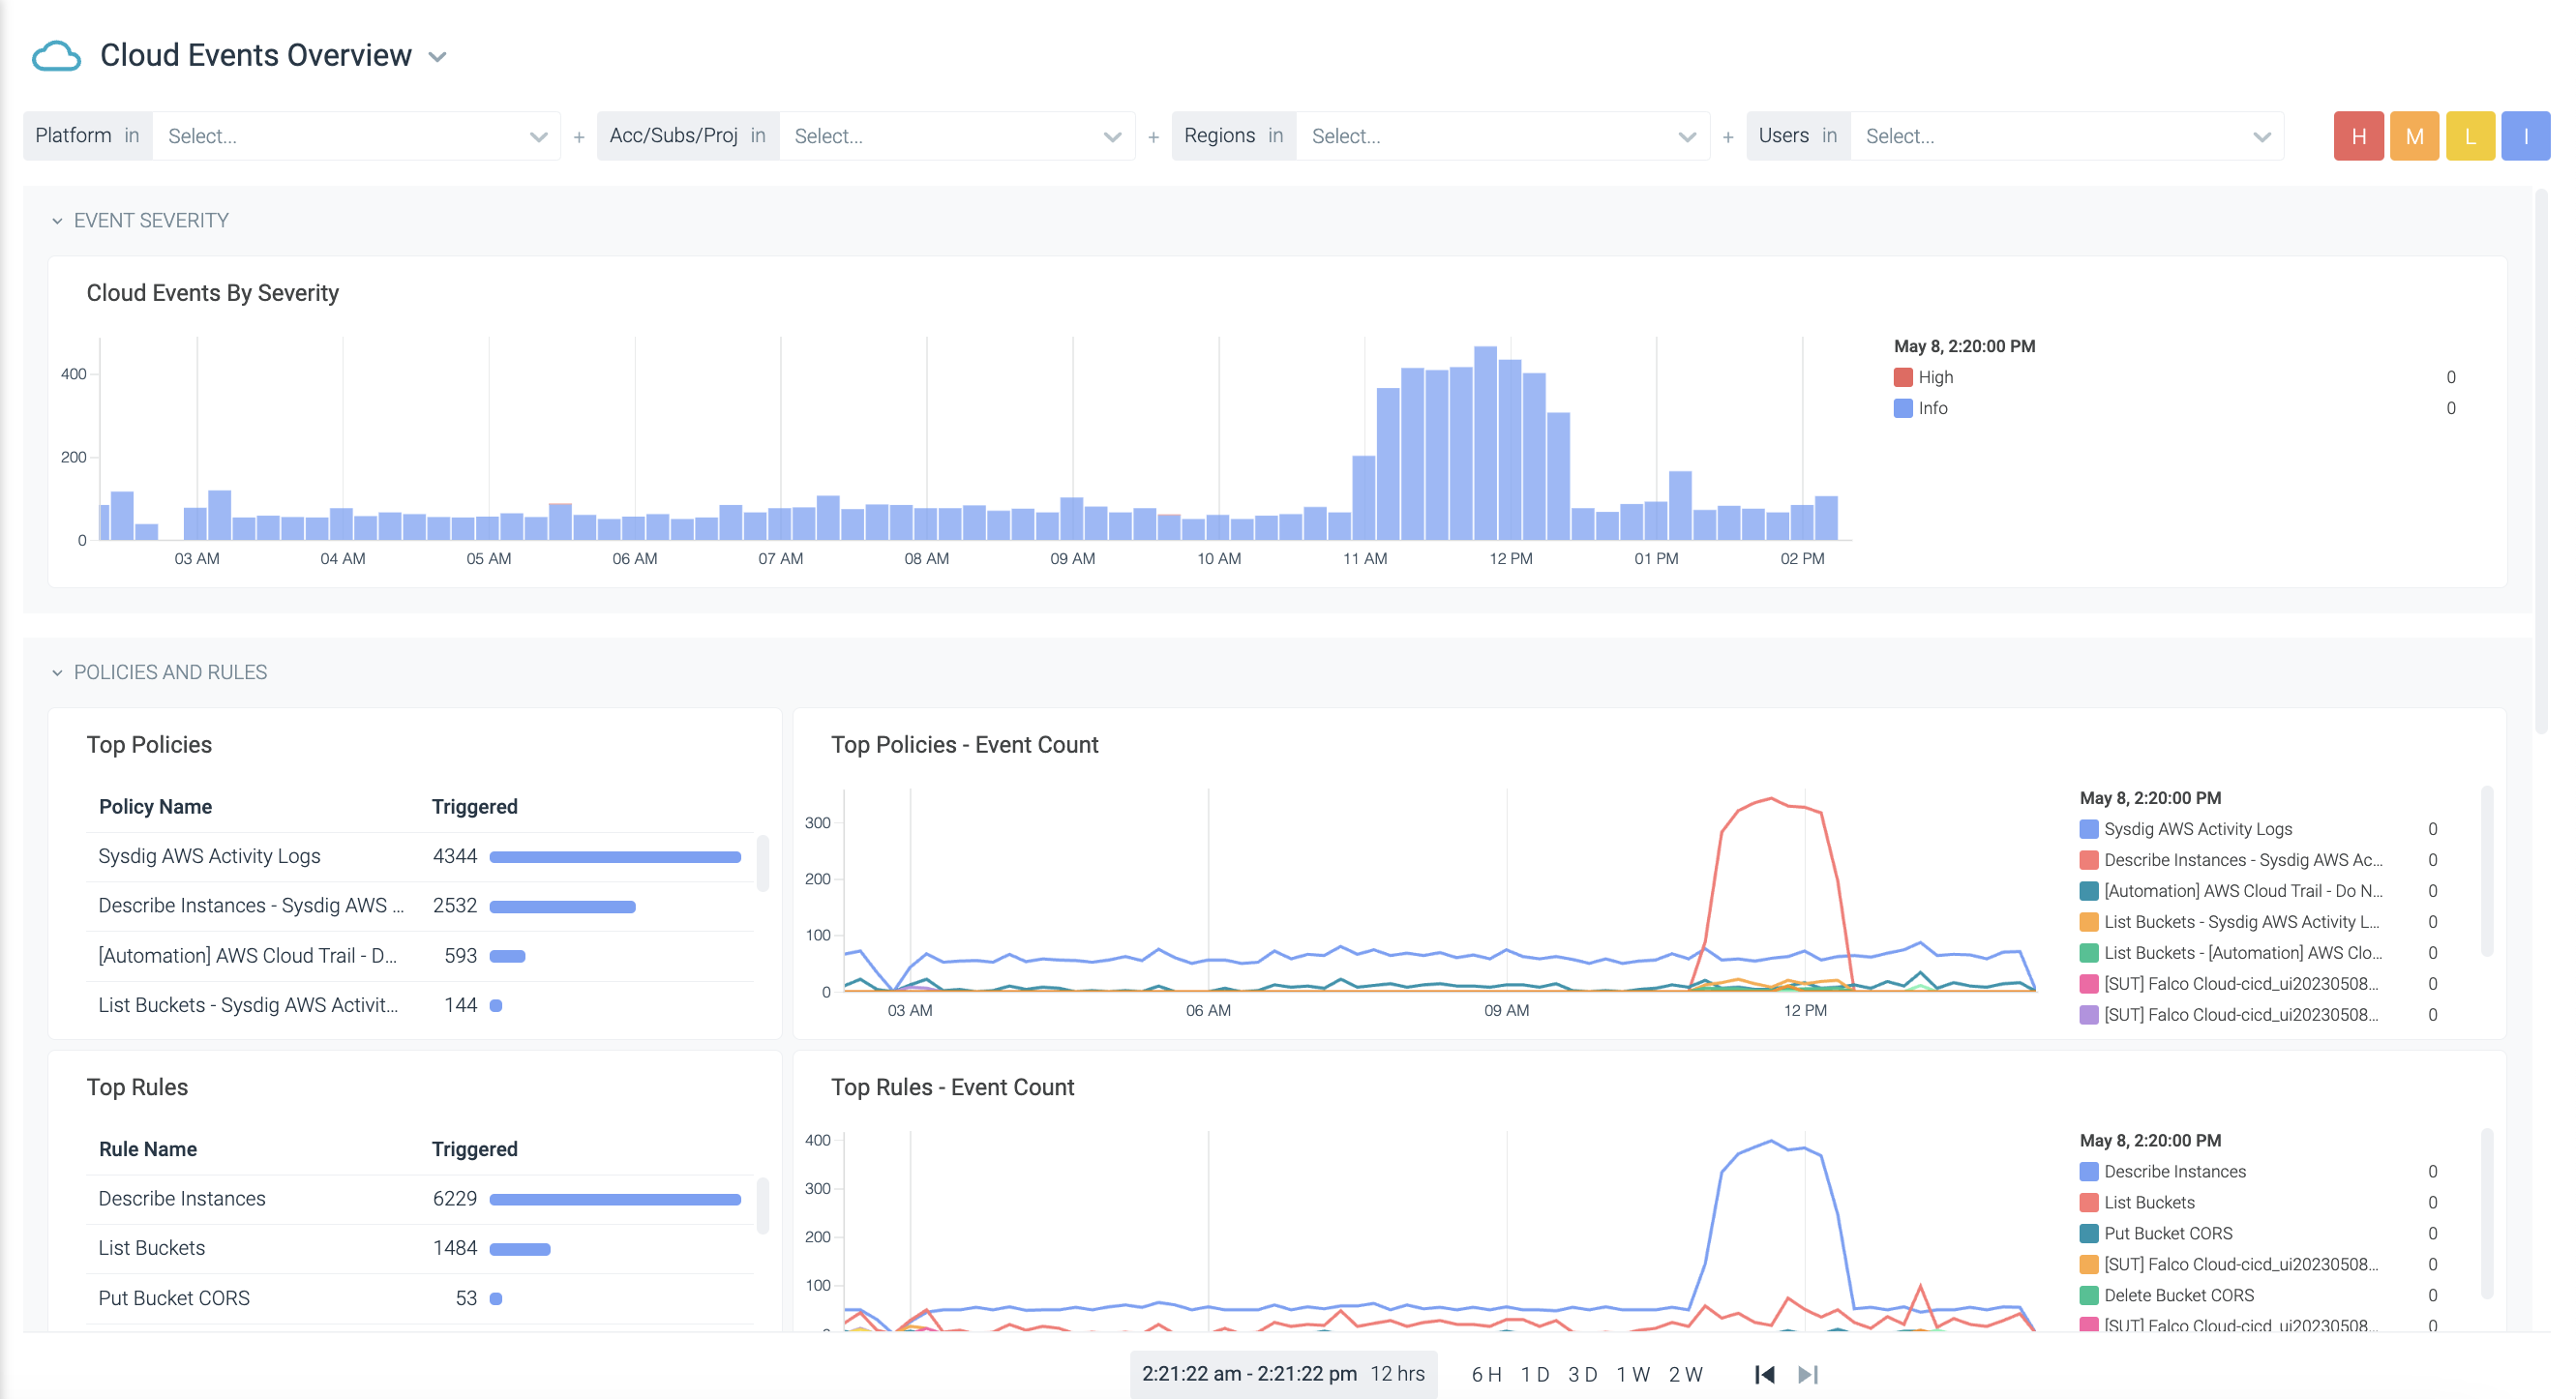
Filters Available
Platform
Account/Project/Subscription (depending on AWS/GCP/Azure)
Region
Cloud Account User
Hosts and Containers Panel
Designed for environments using containers without Kubernetes orchestration.
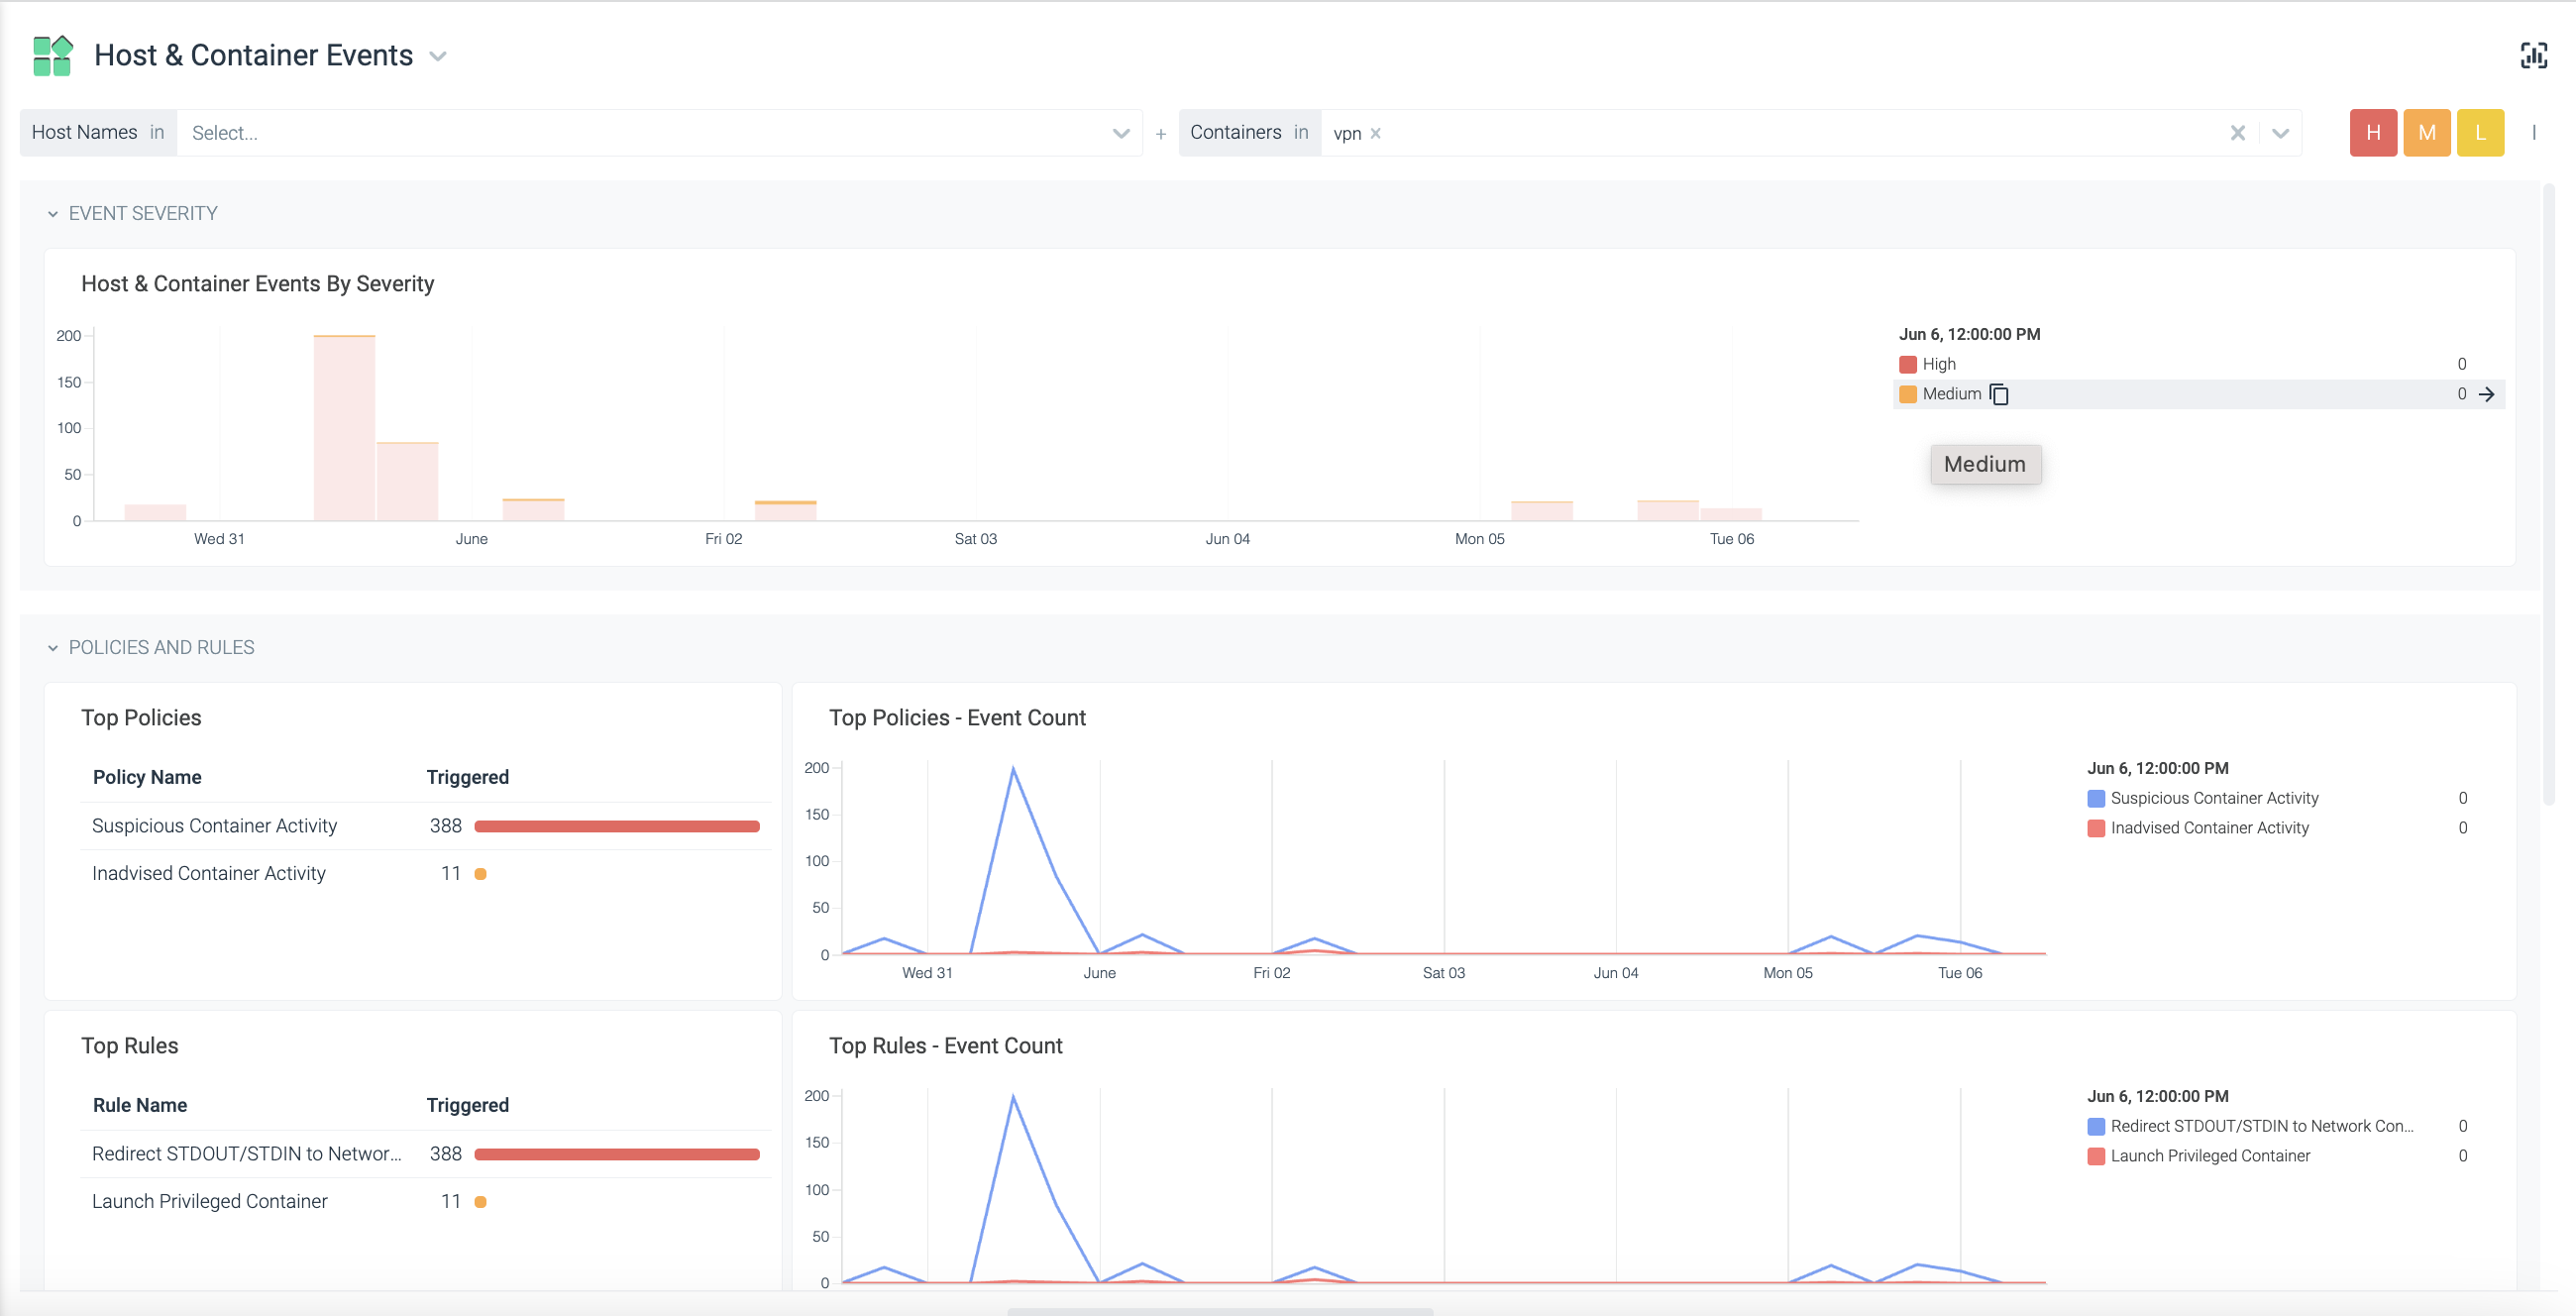
Filters Available
- Host names in
- Containers in
Featured Use Cases
Company Security Usage
The top trend panels are designed to guide Security workflows.
They present an overview of:
- Trends of Events in the environment over the past 31 days (in up to two-week increments)
- Policies and rules with most events (up to 20 listings)
- Event data by date or date range
- Clusters, Namespaces, Workloads, Cloud account IDs, Users, hosts, and containers with the most events detected
These allow security managers to answer questions about their risk posture, such as:
- Are my event levels trending down?
- What is my most event-prone environment?
Sample Flows
Identify Progress through Metrics
- Choose the data source you want to view.
- Filter on segments of the infrastructure (specific clusters, accounts, users, hosts, containers) as desired.
- Review the metrics graph to see trends.
- Click on days to identify the difference between them.
- Drill down to event feeds for further investigation.
Feedback
Was this page helpful?
Glad to hear it! Please tell us how we can improve.
Sorry to hear that. Please tell us how we can improve.