HAProxy Ingress OpenShift
This integration is enabled by default.
Versions supported: > v3.11
This integration is out-of-the-box, so it doesn’t require any exporter.
This integration has 28 metrics.
Timeseries generated: The HAProxy ingress router generates ~400 time series per HAProxy router pod.
List of Alerts
| Alert | Description | Format |
|---|---|---|
| [OpenShift-HAProxy-Router] Router Down | Router HAProxy down. No instances running. | Prometheus |
| [OpenShift-HAProxy-Router] HAProxy Down | HAProxy down on a pod. | Prometheus |
| [OpenShift-HAProxy-Router] HAProxy Reload Failure | HAProxy reloads are failing. New configurations will not be applied. | Prometheus |
| [OpenShift-HAProxy-Router] Percentage of routers low | Less than 75% Routers are up. | Prometheus |
| [OpenShift-HAProxy-Router] Route Down | This alert detects if all servers are down in a route | Prometheus |
| [OpenShift-HAProxy-Router] High Latency | This alert detects high latency in at least one server of the route. | Prometheus |
| [OpenShift-HAProxy-Router] Pod Health Check Failure | This alert triggers when there is a recurrent pod health check failure. | Prometheus |
| [OpenShift-HAProxy-Router] Queue not empty in route | This alert triggers when a queue is not empty in a route. | Prometheus |
| [OpenShift-HAProxy-Router] High error rate in route | This alert triggers when the error rate in a route is higher than 15%. | Prometheus |
| [OpenShift-HAProxy-Router] Connection errors in route | This alert triggers when there are recurring connection errors in a route. | Prometheus |
List of Dashboards
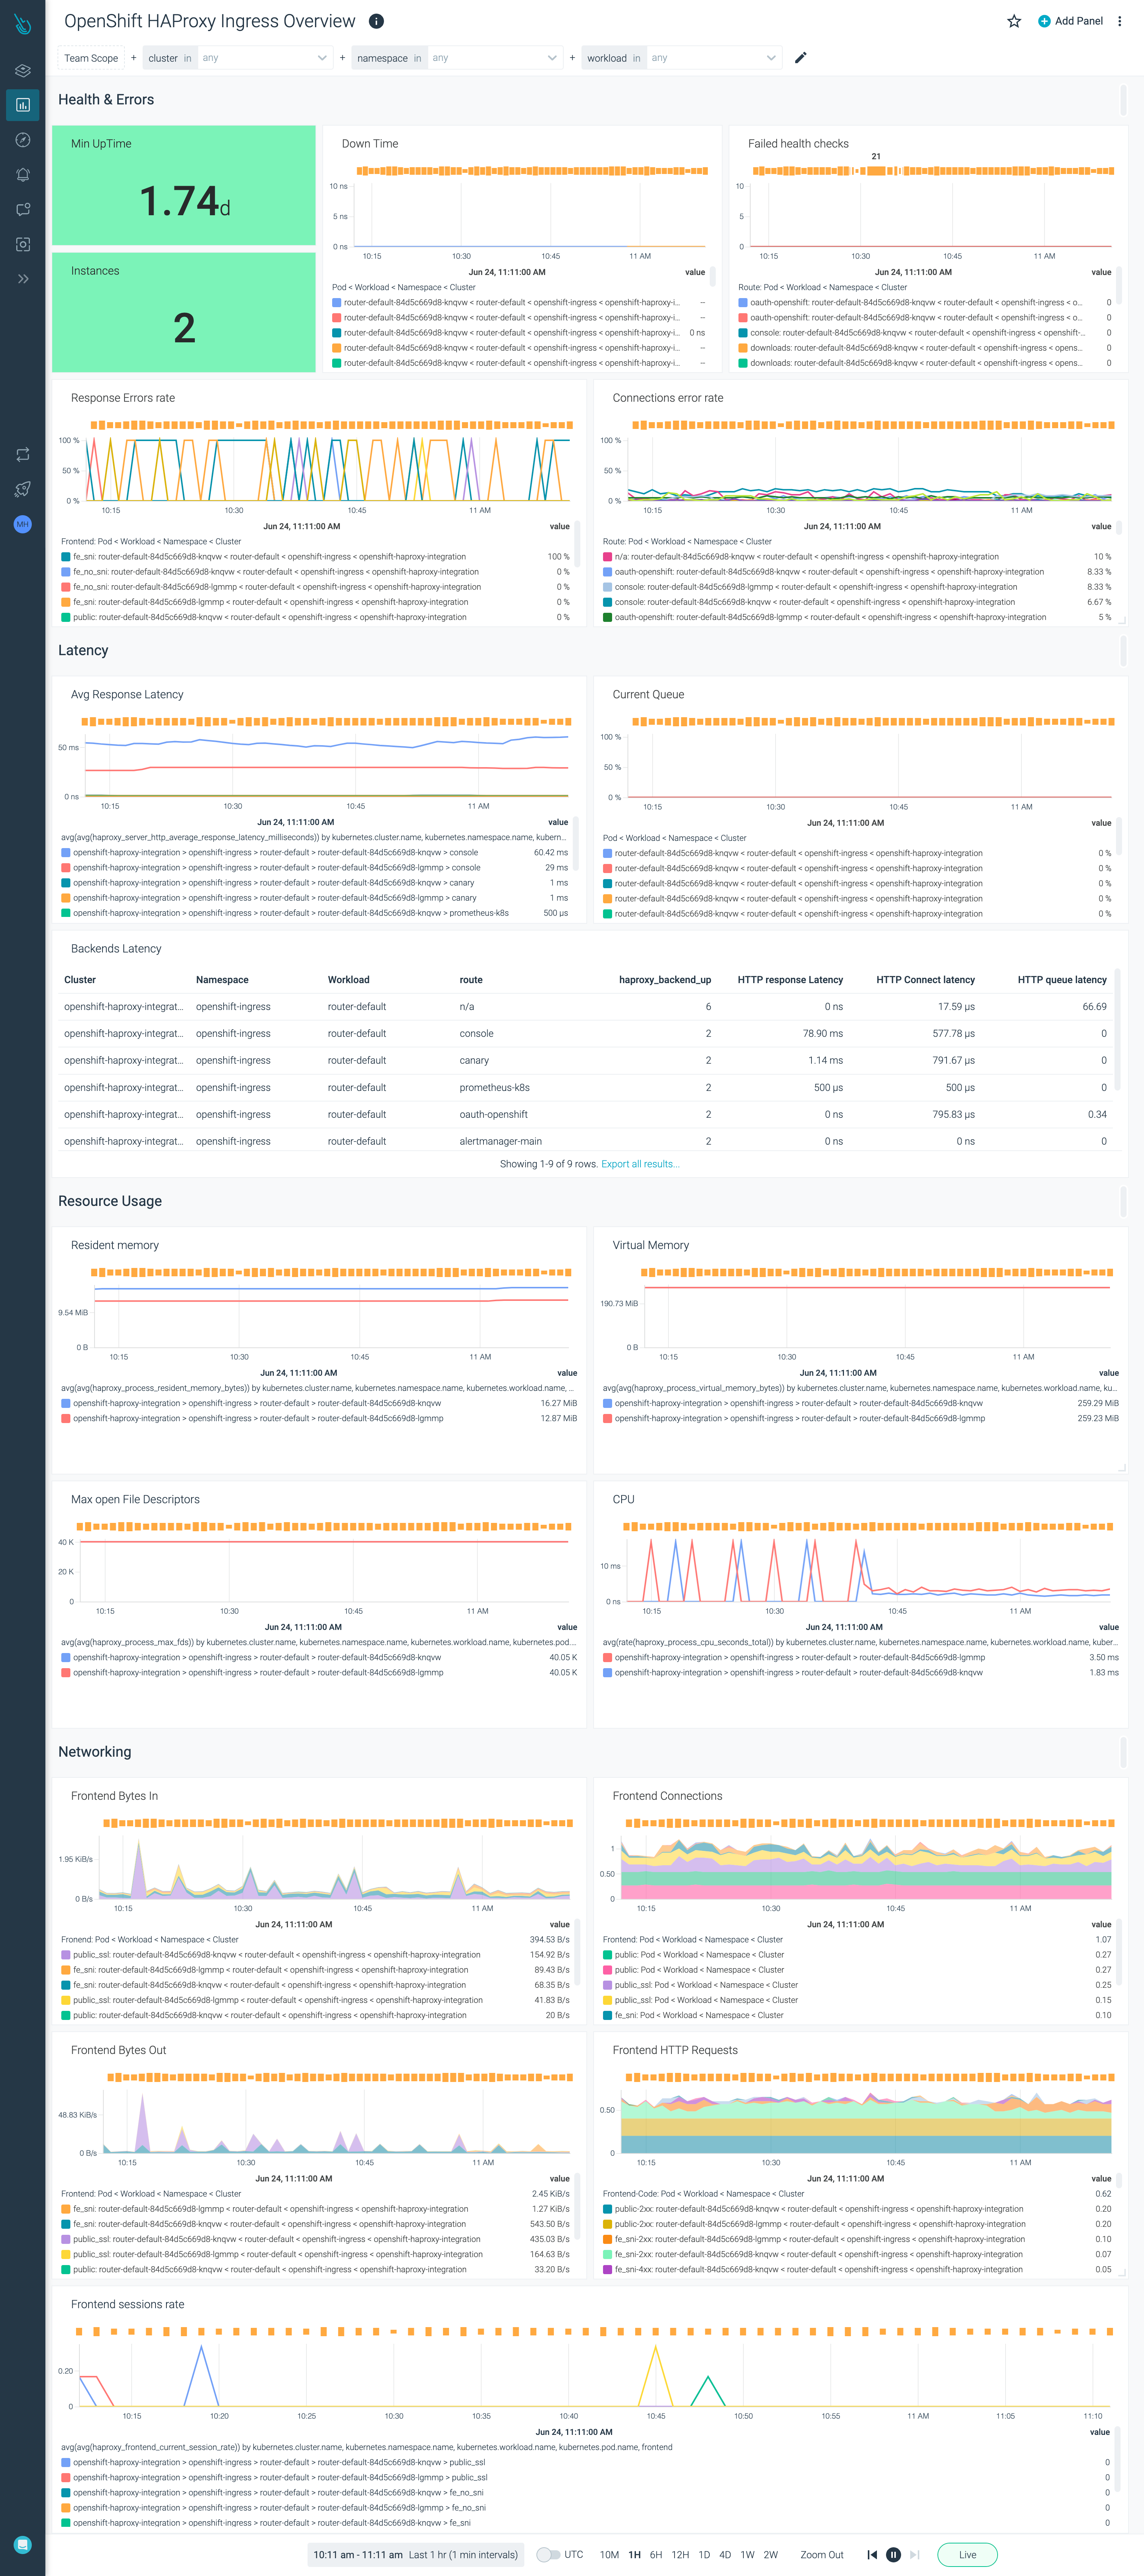
OpenShift HAProxy Ingress Overview
The dashboard provides information on the OpenShift HAProxy Ingress overview.

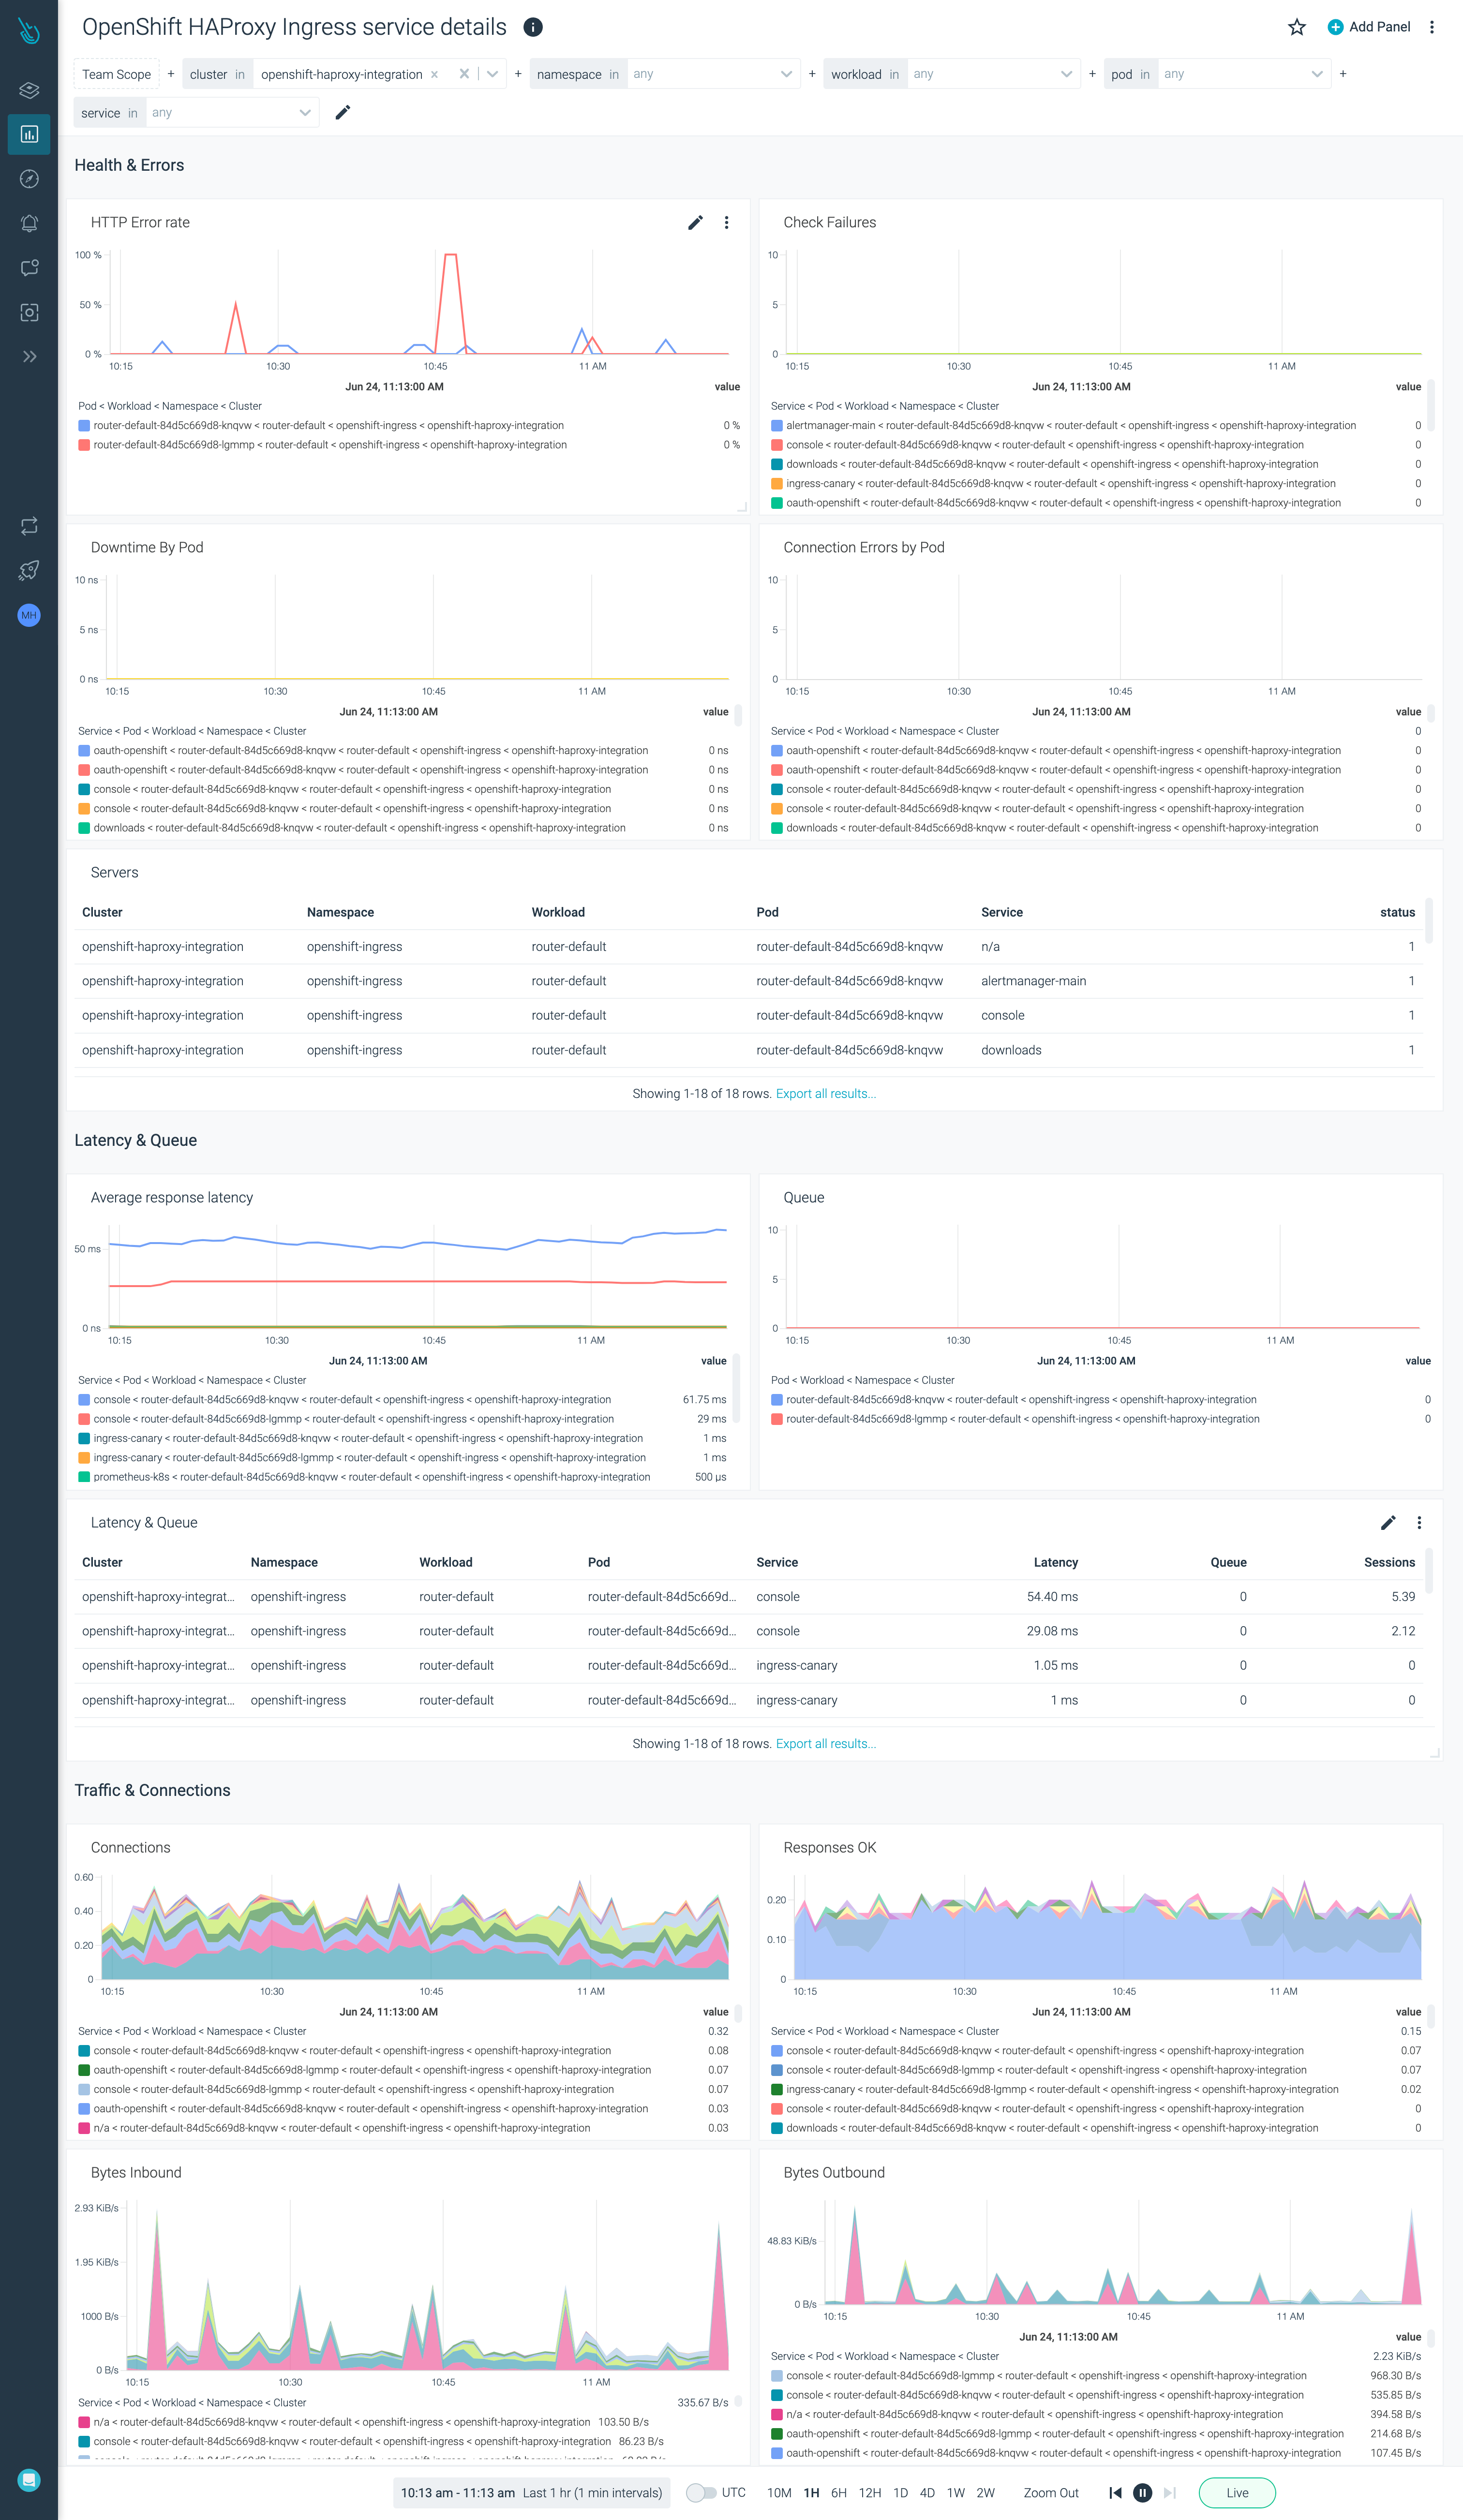
OpenShift HAProxy Ingress Service Details
The dashboard provides information on the OpenShift HAProxy Ingress Service golden signals.

List of Metrics
| Metric name |
|---|
| haproxy_backend_http_average_connect_latency_milliseconds |
| haproxy_backend_http_average_queue_latency_milliseconds |
| haproxy_backend_http_average_response_latency_milliseconds |
| haproxy_backend_up |
| haproxy_frontend_bytes_in_total |
| haproxy_frontend_bytes_out_total |
| haproxy_frontend_connections_total |
| haproxy_frontend_current_session_rate |
| haproxy_frontend_http_responses_total |
| haproxy_process_cpu_seconds_total |
| haproxy_process_max_fds |
| haproxy_process_resident_memory_bytes |
| haproxy_process_start_time_seconds |
| haproxy_process_virtual_memory_bytes |
| haproxy_server_bytes_in_total |
| haproxy_server_bytes_out_total |
| haproxy_server_check_failures_total |
| haproxy_server_connection_errors_total |
| haproxy_server_connections_total |
| haproxy_server_current_queue |
| haproxy_server_current_sessions |
| haproxy_server_downtime_seconds_total |
| haproxy_server_http_average_response_latency_milliseconds |
| haproxy_server_http_responses_total |
| haproxy_server_up |
| haproxy_up |
| kube_workload_status_desired |
| template_router_reload_failure |
Prerequisites
Openshift 3.11
Once the Sysdig agent is deployed, check if it is running on all nodes (compute, master, and infra):
oc get nodes
oc get pods -n sysdig-agent -o wide
Apply this patch in case the Agent is not running on infra/master.
oc patch namespace sysdig-agent --patch-file='sysdig-agent-namespace-patch.yaml'
sysdig-agent-namespace-patch.yaml file
apiVersion: v1
kind: Namespace
metadata:
  annotations:
    openshift.io/node-selector: ""
OpenShift integrates security by default. Therefore, if you want Sysdig agent to scrape HAProxy router metrics, provide it with the necessary permissions. To do so:
oc apply -f router-clusterrolebinding-sysdig-agent-oc3.yaml
router-clusterrolebinding-sysdig-agent-oc3.yaml file
apiVersion: rbac.authorization.k8s.io/v1
kind: ClusterRole
metadata:
  name: haproxy-route-monitoring
rules:
- apiGroups:
  - route.openshift.io
  resources:
  - routers/metrics
  verbs:
  - get
---
apiVersion: rbac.authorization.k8s.io/v1
kind: ClusterRoleBinding
metadata:
  labels:
    app: sysdig-agent
  name: sysdig-router-monitoring
roleRef:
  apiGroup: rbac.authorization.k8s.io
  kind: ClusterRole
  name: haproxy-route-monitoring
subjects:
- kind: ServiceAccount
  name: sysdig-agent
  namespace: sysdig-agent   # Remember to change to the namespace where you have the Sysdig agents deployed
Openshift 4.X
OpenShift integrates security by default. Therefore, if you want Sysdig agent to scrape HAProxy router metrics, provide it with the necessary permissions. To do so:
oc apply -f router-clusterrolebinding-sysdig-agent-oc4.yaml
router-clusterrolebinding-sysdig-agent-oc4.yaml file
apiVersion: rbac.authorization.k8s.io/v1
kind: ClusterRoleBinding
metadata:
  name: router-monitoring-sysdig-agent
roleRef:
  apiGroup: rbac.authorization.k8s.io
  kind: ClusterRole
  name: router-monitoring
subjects:
- kind: ServiceAccount
  name: sysdig-agent
  namespace: sysdig-agent   # Remember to change to the namespace where you have the Sysdig agents deployed
Installation
Installing an exporter is not required for this integration.
Agent Configuration
The default agent job for this integration is as follows:
- job_name: 'haproxy-router'
  scheme: https
  bearer_token_file: /var/run/secrets/kubernetes.io/serviceaccount/token
  tls_config:
    insecure_skip_verify: true
  kubernetes_sd_configs:
  - role: pod
  relabel_configs:
  - action: keep
    source_labels: [__meta_kubernetes_pod_host_ip]
    regex: __HOSTIPS__
  - action: drop
    source_labels: [__meta_kubernetes_pod_annotation_promcat_sysdig_com_omit]
    regex: true
  - source_labels: [__meta_kubernetes_pod_phase]
    action: keep
    regex: Running
  - action: replace
    source_labels: [__address__]
    regex: ([^:]+)(?::\d+)?
    replacement: $1:1936
    target_label: __address__
  - action: replace
    source_labels: [__meta_kubernetes_pod_annotation_prometheus_io_scheme]
    target_label: __scheme__
    regex: (https?)
  - action: replace
    source_labels:
    - __meta_kubernetes_pod_container_name
    - __meta_kubernetes_pod_annotation_promcat_sysdig_com_integration_type
    regex: (router);(.{0}$)
    replacement: openshift-haproxy
    target_label: __meta_kubernetes_pod_annotation_promcat_sysdig_com_integration_type
  - action: keep
    source_labels:
    - __meta_kubernetes_pod_annotation_promcat_sysdig_com_integration_type
    regex: "openshift-haproxy"
  - action: replace
    source_labels: [__meta_kubernetes_pod_uid]
    target_label: sysdig_k8s_pod_uid
  - action: replace
    source_labels: [__meta_kubernetes_pod_container_name]
    target_label: sysdig_k8s_pod_container_name
  metric_relabel_configs:
  - source_labels: [__name__]
    regex: (haproxy_backend_http_average_connect_latency_milliseconds|haproxy_backend_http_average_queue_latency_milliseconds|haproxy_backend_http_average_response_latency_milliseconds|haproxy_backend_up|haproxy_frontend_bytes_in_total|haproxy_frontend_bytes_out_total|haproxy_frontend_connections_total|haproxy_frontend_current_session_rate|haproxy_frontend_http_responses_total|haproxy_process_cpu_seconds_total|haproxy_process_max_fds|haproxy_process_resident_memory_bytes|haproxy_process_start_time_seconds|haproxy_process_virtual_memory_bytes|haproxy_server_bytes_in_total|haproxy_server_bytes_out_total|haproxy_server_check_failures_total|haproxy_server_connection_errors_total|haproxy_server_connections_total|haproxy_server_current_queue|haproxy_server_current_sessions|haproxy_server_downtime_seconds_total|haproxy_server_http_average_response_latency_milliseconds|haproxy_server_http_responses_total|haproxy_server_up|haproxy_up|template_router_reload_failure)
    action: keep
Feedback
Was this page helpful?
Glad to hear it! Please tell us how we can improve.
Sorry to hear that. Please tell us how we can improve.