Legacy Metric Alerts
Sysdig Monitor keeps a watch on time-series metrics, and alert if they violate user-defined thresholds.

The lines shown in the preview chart represent the values for the segments selected to monitor. The popup is a color-coded legend to show which segment (or combination of segments if there is more than one) the lines represent. You can also deselect some segment lines to prevent them from showing in the chart. Note that there is a limit of 10 lines that Sysdig Monitor ever shows in the preview chart.
Defining a Metric Alert
Guidelines
Set a unique name and description: Set a meaningful name and description that help recipients easily identify the alert
Specify multiple segments: Selecting a single segment might not always supply enough information to troubleshoot. Enrich the selected entity with related information by adding additional related segments. Enter hierarchical entities so you have the bottom-down picture of what went wrong and where. For example, specifying a Kubernetes Cluster alone does not provide the context necessary to troubleshoot. In order to narrow down the issue, add further contextual information, such as Kubernetes Namespace, Kubernetes Deployment, and so on.
Specify Metrics
Select a metric that this alert will monitor. You can also define how data is aggregated, such as avg, max, min or sum. To alert on multiple metrics using boolean logic, switch to multi-condition alert.
Configure Scope
Filter the environment on which this alert will apply.
Filter the environment on which this alert will apply. An alert will
fire when a host goes down in the availability zone, us-east-1b.

Use advanced operators to include, exclude, or pattern-match groups, tags, and entities. See Multi-Condition Alerts.
You can also create alerts directly from Explore and Dashboards for automatically populating this scope.
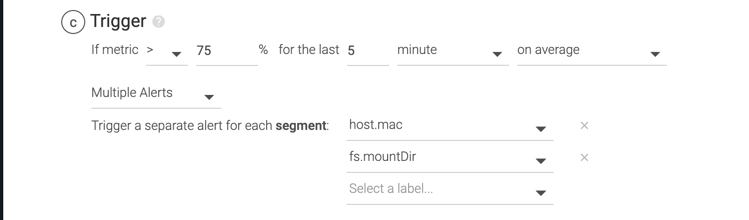
Configure Trigger
Define the threshold and time window for assessing the alert condition. Single Alert fires an alert for your entire scope, while Multiple Alert fires if any or every segment breach the threshold at once.
Metric alerts can be triggered to notify you of different aggregations:
Aggregation | Description |
|---|---|
on average | The average of the retrieved metric values across the time period. Actual number of samples retrieved is used to calculate the value. For example, if new data is retrieved in the 7th minute of a 10-minutes sample and the alert is defined as on average, the alert will be calculated by summing the 3 recorded values and dividing by 3. |
as a rate | The average value of the metric across the time period evaluated. The expected number of values is used to calculate the rate to trigger the alert. For example, if new data is retrieved in the 7th minute of a 10-minutes sample and the alert is defined as as a rate, the alert will be calculated by summing the 3 recorded values and dividing by 10 ( 10 x 1 minute samples). |
in sum | The combined sum of the metric across the time period evaluated. |
at least once | The trigger value is met for at least one sample in the evaluated period. |
for the entire time | The trigger value is met for a every sample in the evaluated period. |
as a rate of change | The trigger value is met the change in value over the evaluated period. |
For example, if the file system used percentage goes above 75 for the last 5 minutes on an average, multiple alerts will be triggered. The mac address of the host and mount directory of the file system will be represented in the alert notification.
Usecases
Number of processes running on a host is not normal
Root volume disk usage in a container is high
Feedback
Was this page helpful?
Glad to hear it! Please tell us how we can improve.
Sorry to hear that. Please tell us how we can improve.