Kubernetes Troubleshooting
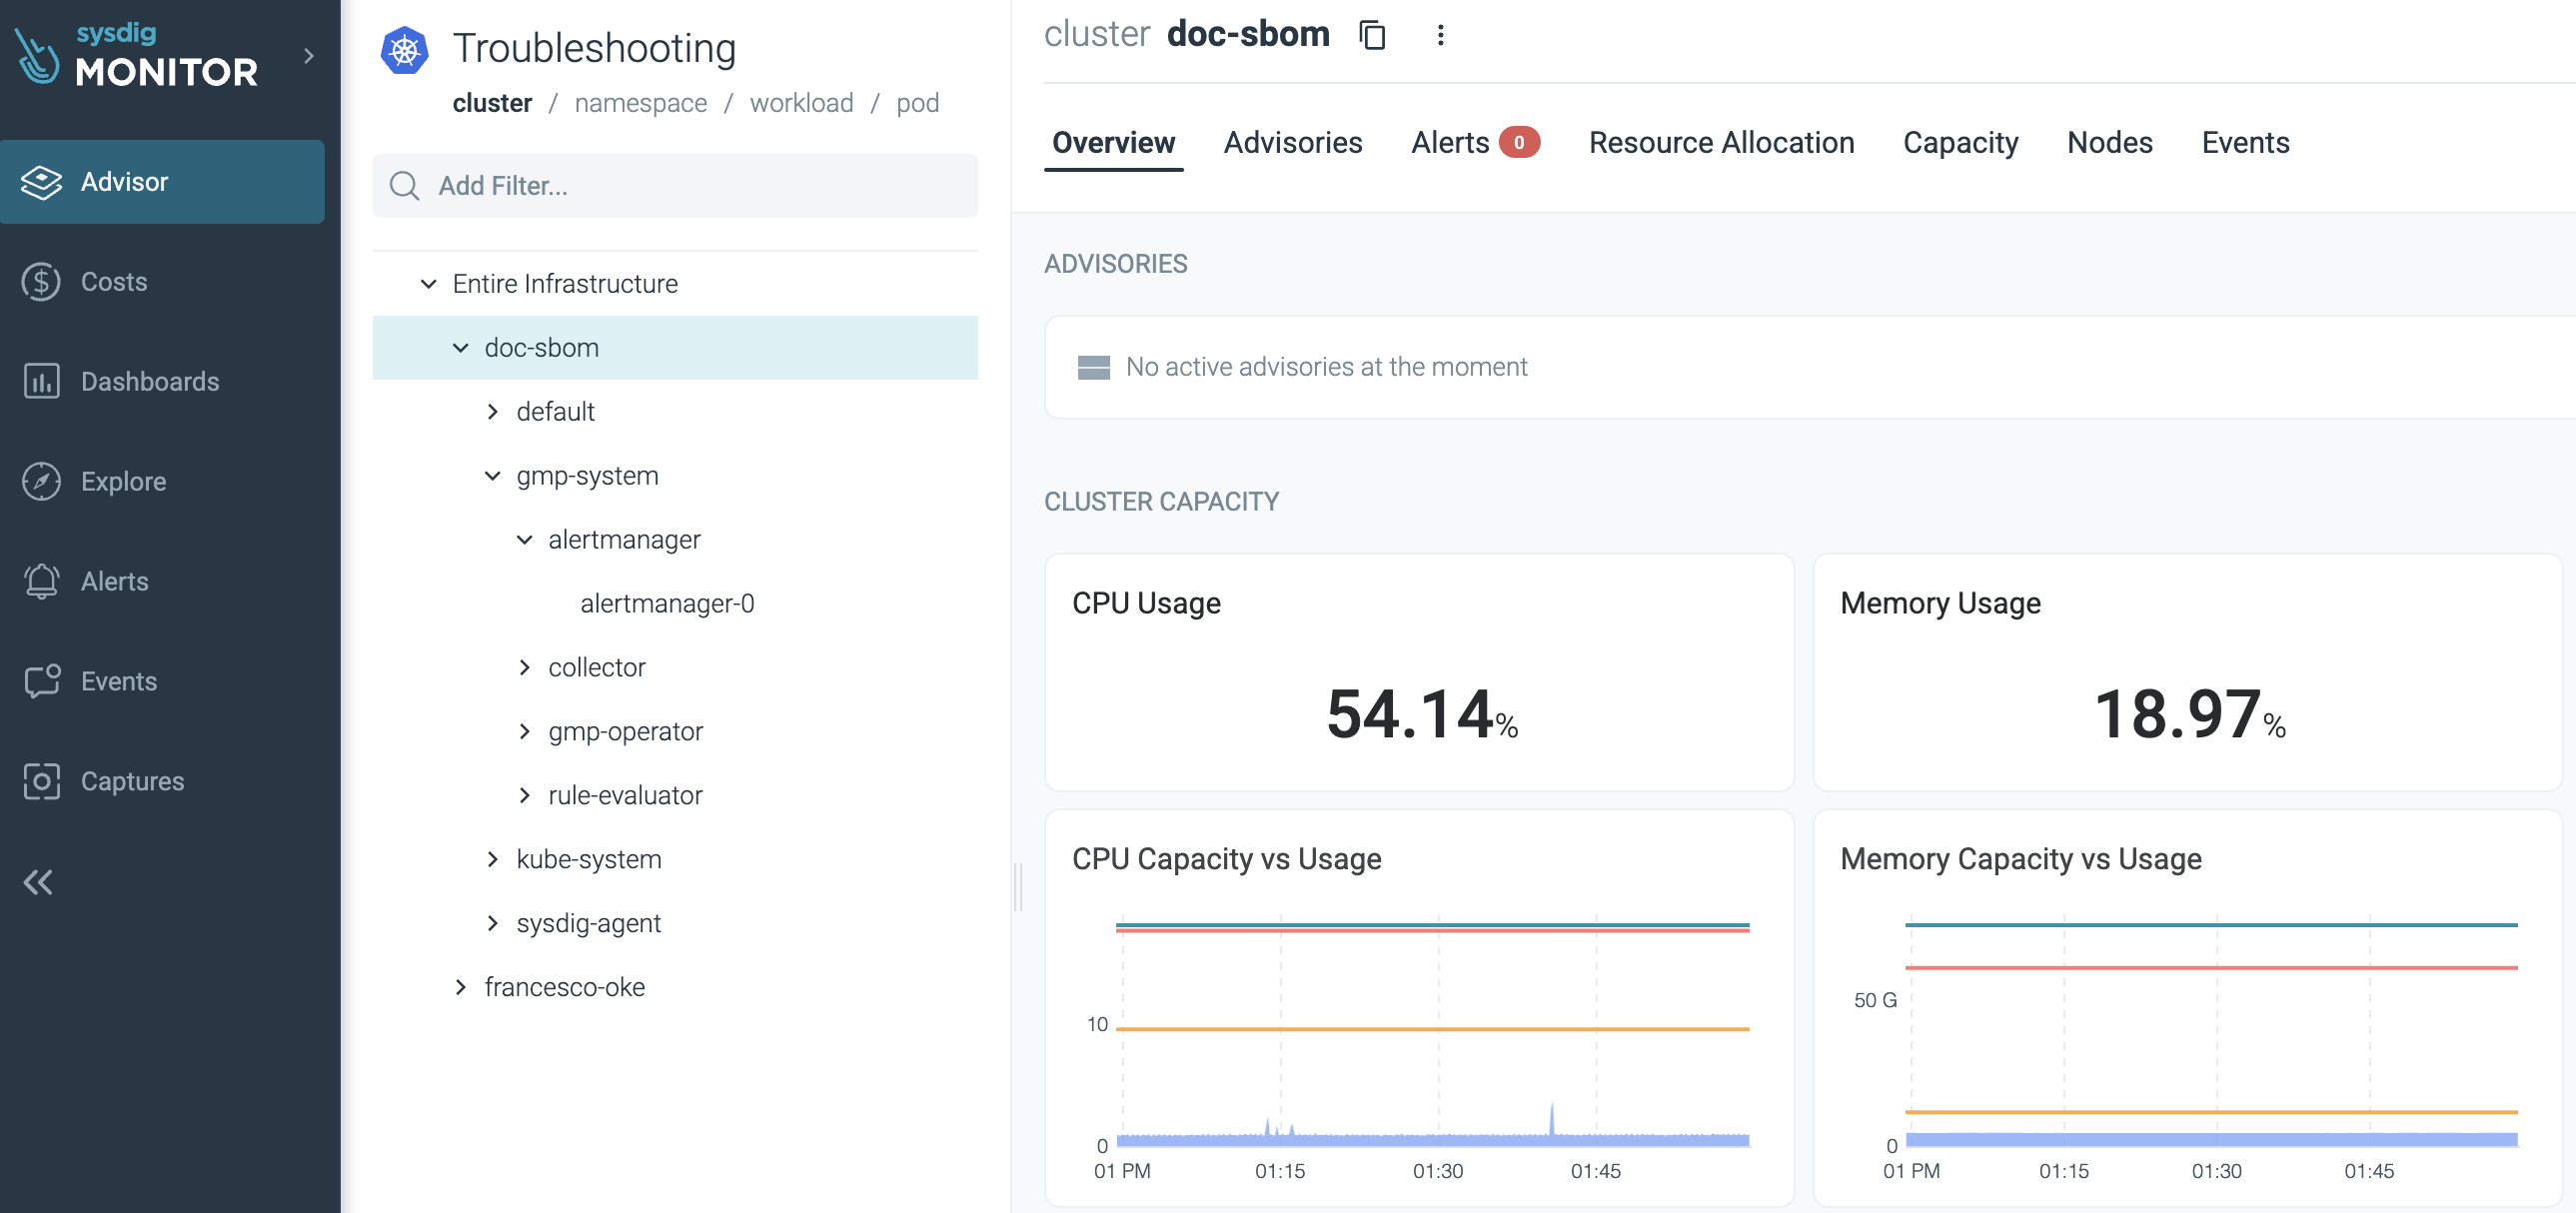
In the Kubernetes | Troubleshooting page of Advisor, different tabs appear based on where in the infrastructure you are viewing. Your current position is indicated by the header in bold under Troubleshooting.
| Entire Infrastructure | Cluster | Namespace | Workload | Pod | |||
|---|---|---|---|---|---|---|---|
| Overview | ✓ | ✓ | ✓ | ✓ | ✓ | ||
| Advisories | ✓ | ✓ | ✓ | ✓ | ✓ | ||
| Alerts | ✓ | ✓ | ✓ | ✓ | ✓ | ||
| Events | ✓ | ✓ | ✓ | ✓ | ✓ | ||
| Resource Allocation | ✓ | ||||||
| Capacity | ✓ | ||||||
| Nodes | ✓ | ||||||
| Workloads | ✓ | ||||||
| Monitoring Integrations | ✓ | ||||||
| Pods | ✓ | ||||||
| Disk | ✓ | ||||||
| Network | ✓ | ||||||
| Containers | ✓ | ||||||
| Processes | ✓ | ||||||
| Logs | ✓ | ||||||
| YAML | ✓ |
Each tab provides a wealth of information relevant to different parts of your infrastructure:
Entire Infrastructure
- Overview: A high level summary of the object, including telemetry and metadata (Kubernetes labels and Annotations). For more details, see Overview.
- Advisories: See the key problems in your infrastructure and how to resolve them. For more detail, see Advisories.
- Alerts: Triggered alerts.
- Events: Events from Kubernetes, container engines, and custom user events.
Cluster only
- Resource Allocation: Contains cluster information, such as requested resources and resource utilization.
- Capacity: Shows the capacity of your resources and the level of overcommit.
- Nodes: When you have a selected a cluster, this tab shows you the status of individual nodes.
Namespace only
- Workloads: Shows information about your workloads, including availability, limits, and resource usage.
- Monitoring Integrations: Displays list of application and infrastructure integrations. You can configure integrations from this tab.
Workload only
- Pods: Shows the status of pods in a workload, including details such as CPU and memory usage.
- Disk: The storage of the node. Provides file and disk metrics, such as network traffic and latency per workload.
- Network: Provides information related to networking and http traffic, such as the number of inbound connections, request latency, and TCP queue length per pod.
Pod only
- Containers: Narrow into a single container in pod.
- Processes: View metrics such as CPU and memory usage, latency, and errors for a container.
- Logs: See live logs of your pods. For more detail, see Live Logs.
- YAML: View the YAML configuration of a container. For more detail, see YAML Configuration.
Overview
This tab includes a summary of the main categories, including advisories, status, and metadata.
Metadata, such as Labels and Annotations, is displayed for clusters, namespaces, workloads and pods. This metadata is sourced from your infrastructure and is taken from the last four hours.
Advisories
Advisories evaluate the thousands of data points being sent by the Sysdig agent, and display a prioritized view of key problems in your infrastructure that affect the health and availability of your clusters and the workloads running on them.
When you select an advisory, relevant information related to the issue is surfaced, such as metrics, events, live logs, and remediation guidance. This enables you to pinpoint and resolve problems faster.
Example Issues Detected
Problem | Description |
|---|---|
A CrashLoopBackOff means that you have a pod starting, crashing, starting again, and then crashing again. This could cause applications to become unavailable. | |
Container Error | Persistent application error resulting in containers being terminated. An application error, or exit code 1, means the container was terminated due to an application problem. |
Containers are hitting their CPU limit and being throttled. CPU throttling will not result in the container being killed, but will starve the container of CPU, resulting in application slowdown. | |
When a container reaches its memory limit it is terminated with an OOMKilled status, or exit code 137. This can lead to application instability or unavailability. | |
Image Pull Error | A container is failing to start as it cannot pull the image. |
Advisories are automatically resolved when the problem is no longer detected.
Live Logs
Advisor can display live logs for a container, which is the equivalent of running kubectl logs. This is useful for troubleshooting application errors or problems such as pods in a CrashLoopBackOff state.
When you select a pod, the Logs tab will appear. If there are multiple containers within a pod, you can select the container you wish to view logs for. Once requested, logs are streamed for 3 minutes before the session is automatically closed. If necessary, you can simply re-start streaming.
Live logs are tailed on-demand and thus not persisted. After a session is closed they are no longer accessible.
Manage User Access to Live Logs
By default live logs are available to users within the scope of their Sysdig Team. Use Custom Roles to manage live logs permissions.
Configure Agent for Live Logs
Live logs are enabled by default in agent 12.7.0 or newer versions. Older versions of the Sysdig agent do not support live logs.
Live logs can be enabled or disabled within the agent configuration.
To turn live logs off globally for a cluster, add the following in the dragent.yaml file:
live_logs:
  enabled: false
If using Helm, this is configured via sysdig.settings. For example:
sysdig:
 # Advanced settings. Any option in here will be directly translated into dragent.yaml in the Configmap
 settings:
   live_logs:
     enabled: false
Troubleshoot Live Logs
If there is a problem with live logs, the following errors will be returned. Contact Sysdig Support for additional help and troubleshooting.
| Error Code | Cause |
|---|---|
| 401 | kubelet doesn’t have the bearer token authorization enabled. |
| 403 | The sysdig-agent ClusterRole is outdated and does not have the node/proxy permission. Use Sysdig Helm Charts to automatically update the agent ClusterRole. |
YAML Configuration
Advisor can display the YAML configuration for pods, which is the equivalent of running kubectl get pod <pod> -o yaml. This is useful to see the applied configuration of a pod in a raw format, as well as metadata and status. To view the YAML, select a pod in Advisor and open the YAML tab.
Manage Access to YAML Configuration
By default, displaying YAML configuration is available to users within the scope of their Sysdig Team. Use Custom Roles to manage permissions. The permission for displaying YAML configuration is Advisor - Kubernetes API.
Configure Agent for YAML Configuration
YAML configuration can be enabled in agent 12.9.0 or newer versions. Older versions of the Sysdig agent do not support YAML configuration.
You can use the agent configuration to enable the YAML configuration.
To turn support for YAML configuration on globally for a cluster, add the following in the dragent.yaml file:
k8s_command:
  enabled: true
If you are using helm, edit sysdig.settings. For example:
sysdig:
 # Advanced settings. Any option in here will be directly translated into dragent.yaml in the Configmap
 settings:
   k8s_command:
     enabled: true
Feedback
Was this page helpful?
Glad to hear it! Please tell us how we can improve.
Sorry to hear that. Please tell us how we can improve.