Time Series Billing
Use the Sysdig Subscription page to view your account licensing, usage, and spending. Based on your current subscription tier, time-series usage, and the number of active agents, you can estimate your Sysdig time series consumption costs and take further action. Time Series Billing works only in SaaS environments and is not currently available in on-prem environments.
See How Time Series Databases Work to learn more about time series and how PromQL works with time series.
Benefits of Time Series Billing
Flexible time series billing allows you to consume as much time series as is necessary for your environment. Time series billing is applicable to “custom” time series, ingested via the following means:
Custom time series ingested through the Sysdig agent.
- Including time series ingested from applications Monitoring Integrations, for example NGINX and Redis.
Custom time series ingested via other Prometheus servers through Prometheus Remote Write.
Custom time series ingested via Cloud Integrations (cloud platform metrics).
See Use Cases for more details.
For more information on understanding and controlling metric usage, including dropping a time series that is not required see Control Time Series Ingestion.
Billing Custom Time Series
Sysdig calculates the time series ingestion overage price in the following way:
- Total custom time series consumption is metered for each hour.
- The consumption is compared against the custom time series entitlement for that hour, based on the subscription.
- The custom time series ingestion overage for the hour is calculated as the difference between the total hourly consumption and the entitlement.
- Each calendar month’s bill is calculated based on the 95th percentile of all hourly time series ingestion overages during that month.
Consuming Custom Time Series
Sysdig meters the following types of custom metrics ingested by the Sysdig agent:
- Prometheus (including Monitor Integrations and custom Prometheus jobs)
- Java Management Extensions (JMX)
- App Checks
- StatsD
In addition, all metrics and metadata ingested via Prometheus Remote Write and cloud platform metrics are metered against custom time series.
Metrics that do not fall into one of the above categories, such as Kube State Metrics (KSM) and container metrics are not considered custom metrics and are therefore not counted against custom time series entitlements.
Time Series Entitlement
Custom time series consumption is calculated against the reserved time series included as an entitlement with your subscription. The basic Sysdig Monitor plan includes 2,000 time series entitlement per agent per hour. You can purchase more by adding on-demand agents or time series packs.
Reserved time series is the number of custom time series per hour a user is entitled to via the Sysdig subscription. The total value of the entitled time series per account (for each hour) is calculated as (the number of reserved agents + the number of connected on-demand agents during that hour) * the number of time series per agent.
Time series (TS) consumed beyond your subscription entitlement are aggregated across all agents running in your environment. For example, if you have two agents running, you can consume 3,000 metrics on one agent and 1,000 on another, for a total of 4,000 TS, without incurring additional charges (based on the default entitlement of 2,000 TS per agent).
The default entitlement of 2000 timeseries is applicable only to custom metrics. Metrics that do not fall into the custom metric category, such as Kube State Metrics (KSM) and container metrics are not considered custom metrics and thus not counted against custom time series entitlements.
Time Series Entitlement Example
Let’s assume that your Sysdig Monitor subscription includes 15 total Sysdig reserved agents. Each one of those agents is entitled to 2,000 custom time series per hour. To determine the total maximum time series for an account, multiply the number of agents by the time series entitlement per agent —15 * 2,000 = 30,000 — which means that the account is entitled to consume 30,000 custom time series per hour aggregated across all agents. Any one agent can consume greater than the 2,000 entitlement as long as the maximum for all agents does not exceed the account entitlements (30,000 in this example).
Any time series consumed beyond your entitlement will be charged an overage fee. Additional time series packs can be purchased to increase your maximum time series entitlement.
Contact Sales to purchase time series packs to extend your subscription entitlement.
Time Series Packs
Purchase time series packs to increase your custom timeseries entitlements. A timeseries pack includes 1,000 time series and is charged monthly.
Using the above example, if you purchase 10 timeseries packs consisting of 1000 timeseries per pack, you will increase the default time series in your account from 30,000 to 40,000. This will entitle you to consume 10,000 more metrics across all of the Sysdig agents.
View Your Subscription
Time Series Visualization
To view your custom time series consumption, open the User Menu and click Settings, then Subscription.
The Subscription page is displayed:
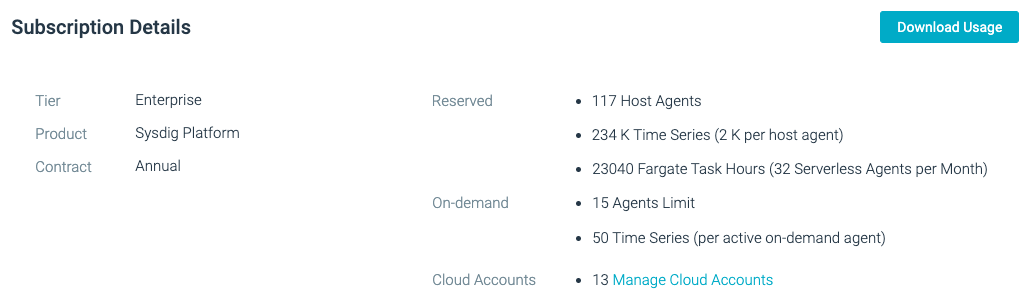

The following details can be seen:
Reserved: The number of reserved agents and the number of time series included with the agents. See Time Series Entitlement.
Agents - Current Usage: The number of agents currently deployed. From here you can click Agent Dashboard to view individual time series consumption by agent, metrics type, and so on.
Time Series - Previous Hour: The total number of time series consumed across all agents in the previous hour. You will see the total custom series entitlement and time series usage against your entitled amount, along with any time series overage beyond your entitlement.
- From here you can click Time Series Dashboard to view details on the total time series consumption for your account.
- Also you can use the menu to download a Comma-seperated values (CSV) file with your hourly usage. See Download Usage.
Monitor Time Series Usage
Time Series Metrics
To help you identify the usage trends that are important to you, Sysdig provides the following metrics via the Time Series Dashboard:
sysdig_ts_usage: The metric reports the number of time series ingested for a user in a 20-minute interval. The dashboard reports the 1-hour usage, which is the maximum of the three 20-minutesysdig_ts_usagemeasurements taken in an hour. This metric can be segmented into metric categories as well.sysdig_ts_usage_10s: The metric reports the number of time series ingested for a user in every 10-second window, per host (agent), and per metric category.
Download Usage
You can download the usage report as a CSV file. On the Subscription page, under Subscription Details, click Download Usage. In the report you can view the following:
User ID
Time
Number of Reserved Agents
Number of Connected On-Demand Agents
Time Series Included per Sysdig Agent
Time Series Usage Dashboard
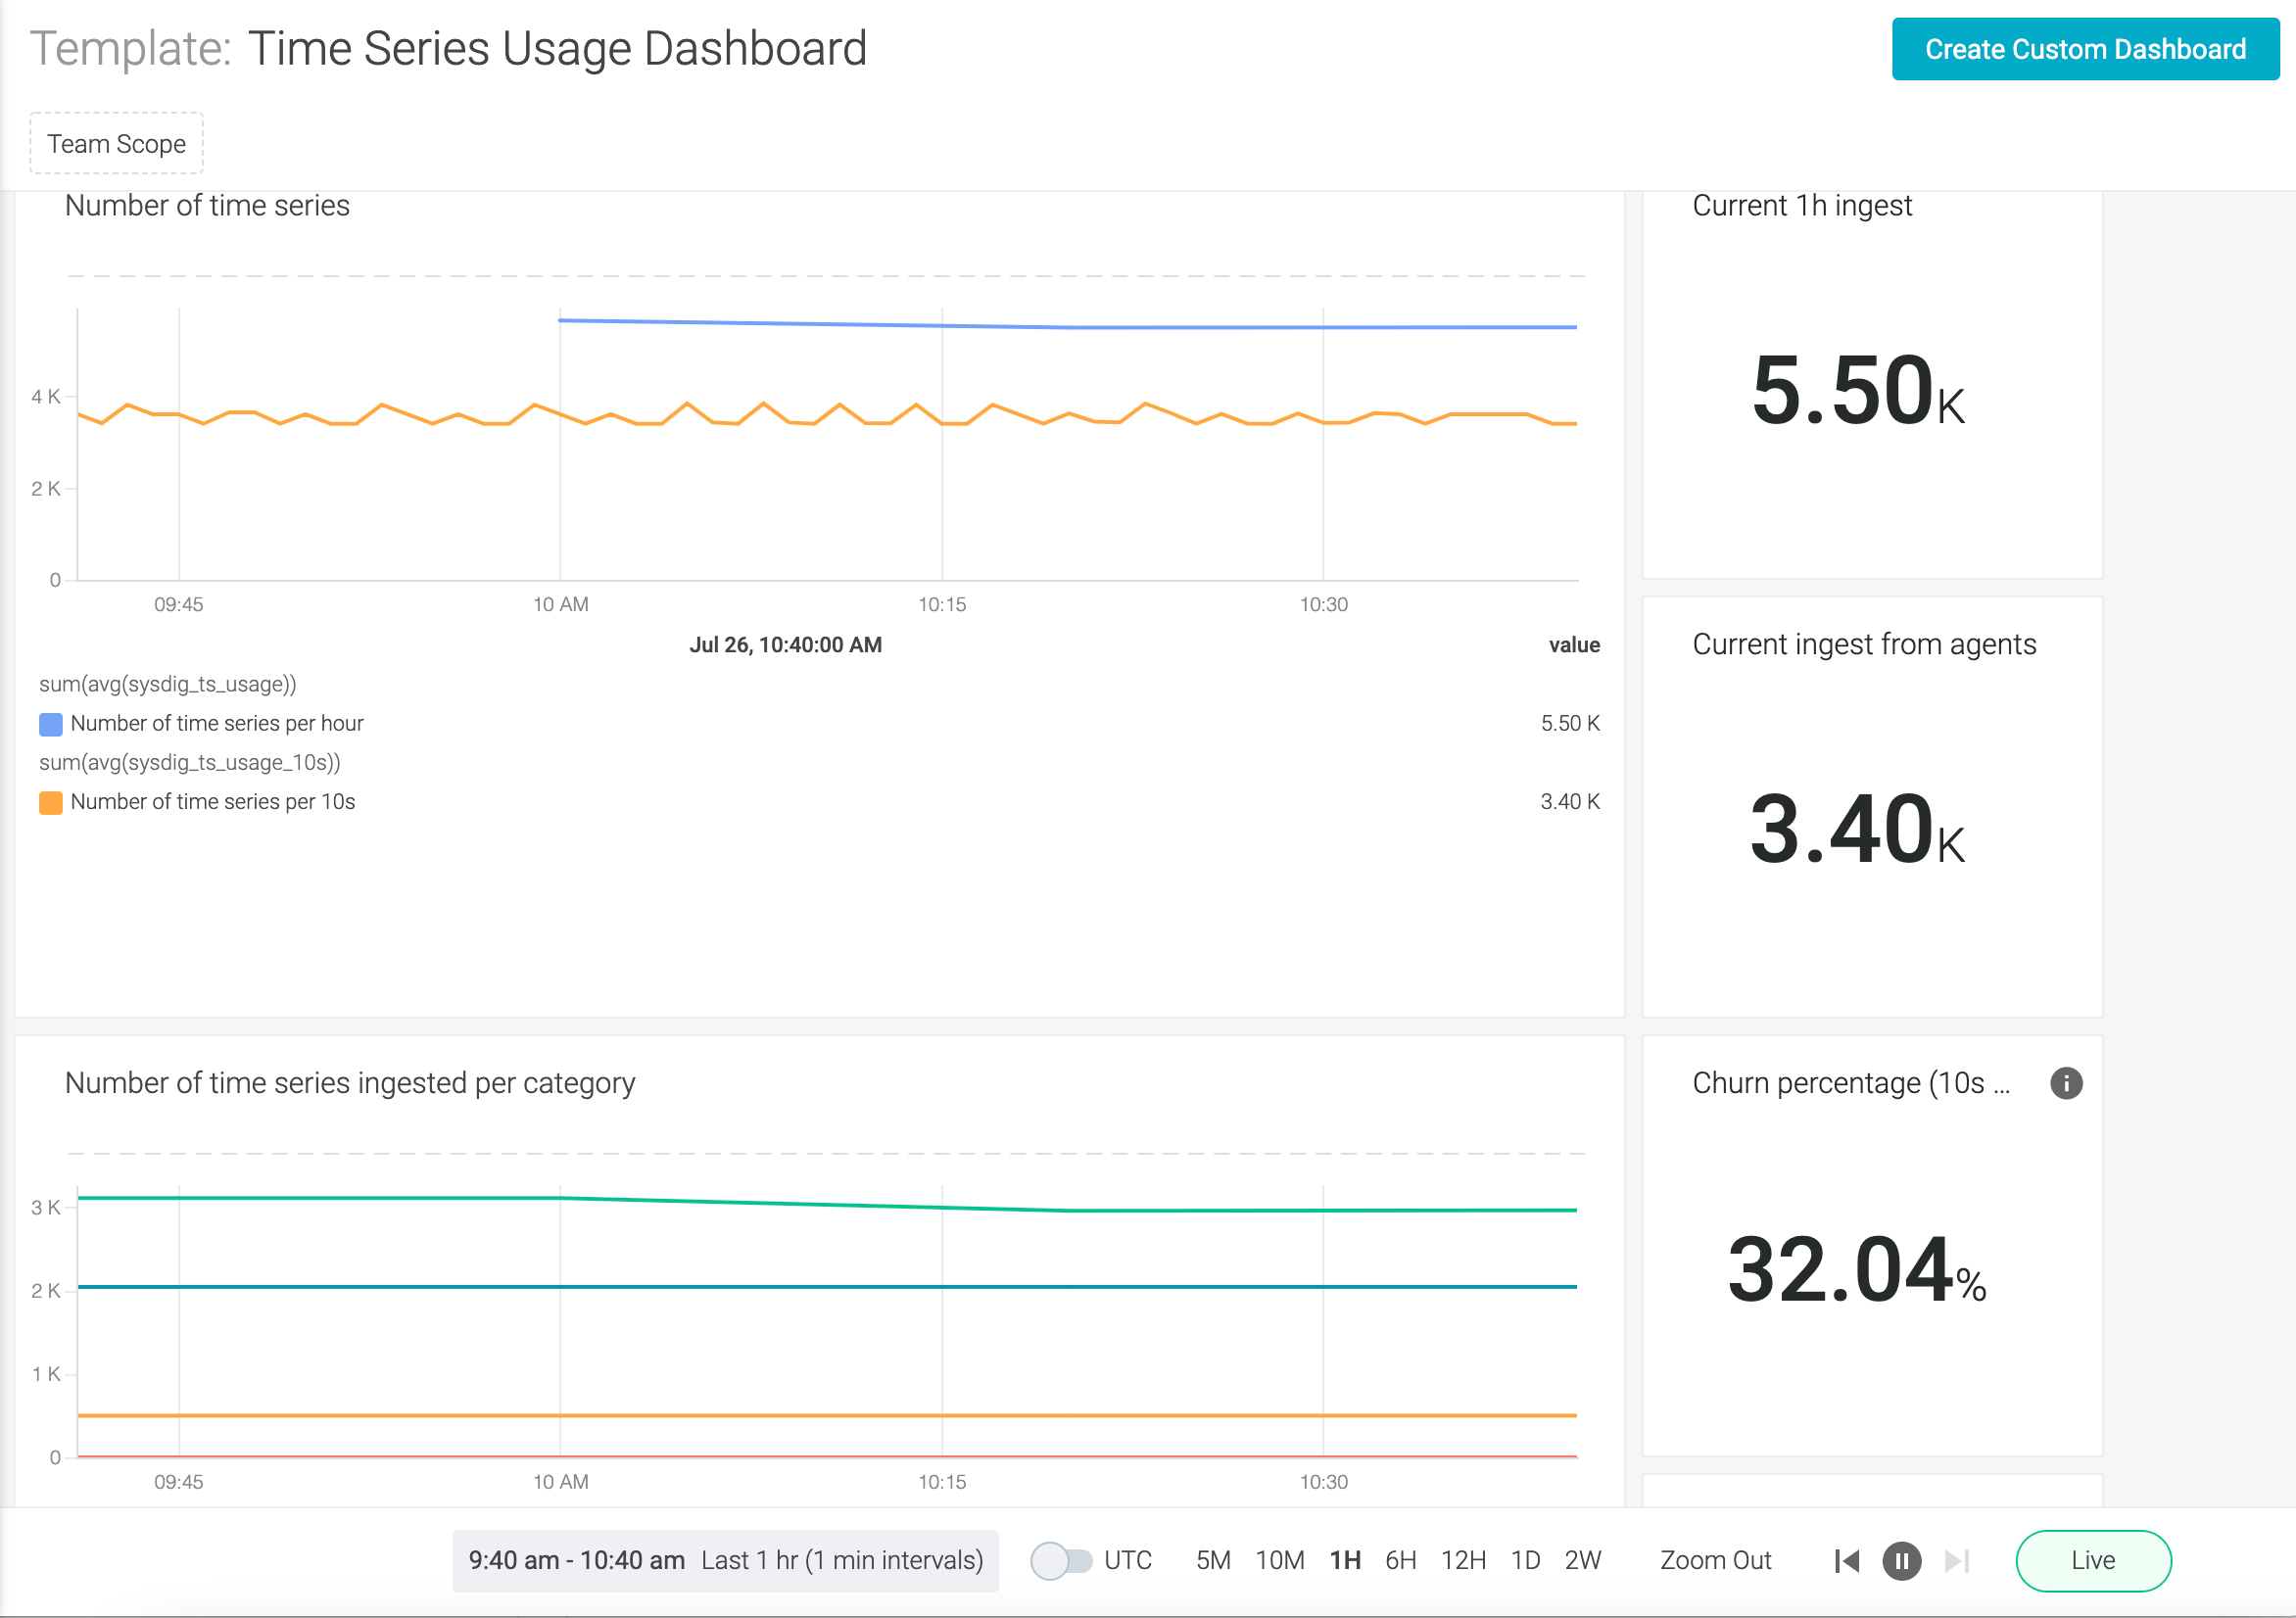
Sysdig provides a Time Series Usage Dashboard with insight into your time series usage data. You can view time series ingestion at a glance to discover and analyze trends on where the time series is coming from. The dashboard shows the total number of time series; top hosts by time series ingestion, current ingestion rate, churn percentage, and so on.
Access the Time Series Dashboard
On the Subscription page, under Usage, click Time Series Dashboard. You can view the following:
- Current 1 Hour Ingestion
- Current Ingestion from Agents
- Churn Percentage
- The average number of time series per host
- The number of time series ingested per category
- Host-level ingestion
Calculate Time Series Usage
Time series usage is calculated by using the sysdig_ts_usage metric. The metric reports the number of time series ingested for a user in an hour (sum of the maximum of three 20 minutes). For each hour, the number of time series ingested is calculated, and then the value is deducted from the number of reserved time series. This value is stored as the usage record.
An hour period is considered in order to take the churn into account. Sysdig uses the sysdig_ts_usage_10s metric to calculate the spikes caused by churns and provides you with the churn percentage in the dashboard.
Sysdig uses the 95th percentile to calculate the exceeding cost of usage. At the end of the month, the 95th percentile of the total number of active series ingested per hour is calculated. Calculating the 95th percentile reduces the chances of billing you for unexpected spikes caused by churns.
Churn Rate
When a time series stops receiving new data points, it becomes inactive. This event is called time series churn. It occurs more often during an upgrade in a Kubernetes cluster or when containers are replaced by new ones. Restarts, redeploys, and dynamic workloads also cause churn and generate additional time series. For example, in cases where the container_id label in a container metric changes, all the existing time series are subsequently replaced by new time series (with the new container_id value).
The churn rate is the number of time series that churn over time. Sysdig uses the sysdig_ts_usage_10s metric to analyze these scenarios.
The Time Series Usage Dashboard provides a ratio of time series detected at 1-hour period and 10-second period. This ratio is known as the churn percentage and it is expressed as this PromQL query:
(sum(sysdig_ts_usage{metric_category!='PROMETHEUS_REMOTE_WRITE'}) -
sum(sysdig_ts_usage_10s)) /
sum(sysdig_ts_usage{metric_category!='PROMETHEUS_REMOTE_WRITE'}) * 100
Time series collected by Prometheus Remote Write are excluded from this ratio because they are not collected by the Sysdig agent.
Time Series Billing Example
Time series billing is calculated per month. A basic subscription will provide you with 2,000 time series per agent. This entitlement is applicable only to custom metrics, while you can continue consuming metrics from Sysdig and kube-state-metrics (KSM) without incurring additional costs. Time series consumed beyond your subscription limit will be charged and are aggregated across all agents running in your environment.
For example, if you have three agents running in your environment with the following consumption details:
- Entitled number of time series per hour (reserved agents * 2,000): 3 * 2,000 = 6,000
- Actual time series consumed by all agents = 7000
Any overage is calculated by subtracting the total entitlement value from the actual consumption value, in this case (7,000 - 6,000) = 1,000. This account would be charged over an overage of 1,000 time series.
Control Time Series Ingestion
For more information on controlling metric usage, see the following:
Use Cases
On-Demand Time Series Consumption
Let’s say you have a Sysdig Monitor account that primarily consumes metrics from downstream Prometheus servers via Prometheus Remote Write. As such, you have only licensed the account for one Sysdig Agent, which entitles your account to 2,000 time series.
Assuming the following volume examples:
- Two Prometheus Servers sending metrics to Sysdig via Remote Write
- Prometheus Server 1 generates a
50,000time series consistently every hour during a month - Prometheus Server 2 generates a
150,000time series consistently every hour during a month - One Sysdig agent which collects
1000time series consistently every hour during a month
The time series billing for the month is calculated as follows:
- Time series usage is the same for every hour: Total custom time series consumed - Subscription entitlement
(50,000 + 150,000 + 1,000) - 2,000 = 199,000
On-demand time series pricing is measured in blocks of 1000 time series per month. To determine the amount of on-demand time series you will be billed for, divide the total time series usage from the above calculation and divide by 1000:
- The number of on-demand units consumed =
(199,000 / 1000) = 199
If the time series on-demand price is $7.5 for up to one unit of 1000 time series, the total monthly cost for this use case = $7.5 * 199 = $1592.50 per month.
Metric Packs Time Series Consumption
Extending the above example, you can see how purchasing individual time series packs will extend your time series entitlement.
Assume:
- Two Prometheus Servers
- Prometheus Server 1 generates a
50,000time series - Prometheus Server 2 generates
150,000time series - One Sysdig agent that collects
1000time series 100pre-purchased time series packs, which is equivalent to100,000time series
The billing for the month is calculated as follows:
- Total subscription capacity: (Total time series consumption - (time series entitlement from time series pack + subscription entitlement))
(50,000 + 150,000 + 1,000) - (100,000 + 2,000) = 99,000
Pre-purchased time series packs also entitle you to 1000 time series per month per pack.
If the pre-purchase price for time series packs is $5 ($2.50 less per 1000 time series than the on-demand usage price), and you’ve purchased 100 packs, that brings your pre-purchase time series entitlement cost to $500 per month.
To calculate your overall monthly cost, you would determine the total time series entitlement subtracted from the total time series consumed, then include the amount already paid for in pre-paid time series packs. Any resulting time series overage beyond the included entitlement plus the pre-purchased time series pack entitlement would be billed at the on-demand rate of $7.50 for each 1000 time series block.
Total number of time series consumed =
(50,000 + 150,000 + 1,000) = 201,000Total time series entitlement:
(100,000 + 2,000) = 102,000Time series overage:
(201,000 - 102,000) = 99,000On-demand time series cost:
(99,000 / 1,000) * 7.50 = $742.50(you would be purchasing 99 1000-packs of on-demand time series as the overage above what is already covered by your entitlement)
Total monthly time series cost = Cost of pre-purchased time series packs + cost of total overage:
($500 + $742.50) =$1,242.50
Feedback
Was this page helpful?
Glad to hear it! Please tell us how we can improve.
Sorry to hear that. Please tell us how we can improve.